The truth about what happened Aug 22 to the Nasdaq is that new limit-up/limit-down rules took effect in derivatives (exchange-traded products) listed at Arca at the same time that new options began trading marketwide that day. Since the market is full of complex, multi-leg trades, bad data propagated, affecting Goldman’s options-trading algorithms Tuesday, spawning hundreds of derivatives trading halts by VIX expirations Wednesday, and producing bad data in the consolidated tape by Thur, halting Nasdaq trading. So the real culprit was the SEC. But it’s bad form to say publicly that the regulator is responsible for jeopardizing the market.I can't vouch for the story, or even for understanding it all. But I'm interested in several emerging stories that some trading pathologies are in part unintended consequences of SEC regulation. It's also not the first time I hear of financial market participants afraid to speak out and earn the disfavor of their regulator.
Showing posts with label Finance. Show all posts
Showing posts with label Finance. Show all posts
Wednesday, August 28, 2013
Nasdaq freeze
An anonymous correspondent explained last week's Nasdaq freeze thus.
Monday, August 26, 2013
Macro-prudential policy
 |
| Source: Wall Street Journal |
Interest rates make the headlines, but the Federal Reserve's most important role is going to be the gargantuan systemic financial regulator. The really big question is whether and how the Fed will pursue a "macroprudential" policy. This is the emerging notion that central banks should intensively monitor the whole financial system and actively intervene in a broad range of markets toward a wide range of goals including financial and economic stability.
For example, the Fed is urged to spot developing "bubbles," "speculative excesses" and "overheated" markets, and then stop them—as Fed Governor Sarah Bloom Raskin explained in a speech last month, by "restraining financial institutions from excessively extending credit." How? "Some of the significant regulatory tools for addressing asset bubbles—both those in widespread use and those on the frontier of regulatory thought—are capital regulation, liquidity regulation, regulation of margins and haircuts in securities funding transactions, and restrictions on credit underwriting."
This is not traditional regulation—stable, predictable rules that financial institutions live by to reduce the chance and severity of financial crises. It is active, discretionary micromanagement of the whole financial system. A firm's managers may follow all the rules but still be told how to conduct their business, whenever the Fed thinks the firm's customers are contributing to booms or busts the Fed disapproves of.
Macroprudential policy explicitly mixes the Fed's macroeconomic and financial stability roles. Interest-rate policy will be used to manipulate a broad array of asset prices, and financial regulation will be used to stimulate or cool the economy.
Foreign central banks are at it already, and a growing consensus among international policy types has left the Fed's relatively muted discussions behind. The sweeping agenda laid out in "Macroprudential Policy: An Organizing Framework," a March 2011 International Monetary Fund paper, is a case in point.
"The monitoring of systemic risks by macroprudential policy should be comprehensive," the IMF paper explains. "It should cover all potential sources of such risk no matter where they reside." Chillingly, policy "should be able to encompass all important providers of credit, liquidity, and maturity transformation regardless of their legal form, as well as individual systemically important institutions and financial market infrastructures."
What could possibly go wrong?
It's easy enough to point out that central banks don't have a great track record of diagnosing what they later considered "bubbles" and "systemic" risks. The Fed didn't act on the tech bubble of the 1990s or the real-estate bubble of the last decade. European bank regulators didn't notice that sovereign debts might pose a problem. Also, during the housing boom, regulators pressured banks to lend in depressed areas and to less creditworthy customers. That didn't pan out so well.
More deeply, the hard-won lessons of monetary policy apply with even greater force to the "macroprudential" project.
First lesson: Humility. Fine-tuning a poorly understood system goes quickly awry. The science of "bubble" management is, so far, imaginary.
Consider the idea that low interest rates spark asset-price "bubbles." Standard economics denies this connection; the level of interest rates and risk premiums are separate phenomena. Historically, risk premiums have been high in recessions, when interest rates have been low.
One needs to imagine a litany of "frictions," induced by institutional imperfections or current regulations, to connect the two. Fed Governor Jeremy Stein gave a thoughtful speech in February about how such frictions might work, but admitting our lack of real knowledge deeper than academic cocktail-party speculation.
Based on this much understanding, is the Fed ready to manage bubbles by varying interest rates? Mr. Stein thinks so, arguing that "in an environment of significant uncertainty . . . standards of evidence should be calibrated accordingly," i.e., down. The Fed, he says, "should not wait for "decisive proof of market overheating." He wants "greater overlap in the goals of monetary policy and regulation." The history of fine-tuning disagrees. And once the Fed understands market imperfections, perhaps it should work to remove them, not exploit them for price manipulation.
Second lesson: Follow rules. Monetary policy works a lot better when it is transparent, predictable and keeps to well-established traditions and limitations, than if the Fed shoots from the hip following the passions of the day. The economy does not react mechanically to policy but feeds on expectations and moral hazards. The Fed sneezed that bond buying might not last forever and markets swooned. As it comes to examine every market and targets every single asset price, the Fed can induce wild instability as markets guess the next anti-bubble decree.
Third lesson: Limited power is the price of political independence. Once the Fed manipulates prices and credit flows throughout the financial system, it will be whipsawed by interest groups and their representatives.
How will home builders react if the Fed decides their investments are bubbly and restricts their credit? How will bankers who followed all the rules feel when the Fed decrees their actions a "systemic" threat? How will financial entrepreneurs in the shadow banking system, peer-to-peer lending innovators, etc., feel when the Fed quashes their efforts to compete with banks?
Will not all of these people call their lobbyists, congressmen and administration contacts, and demand change? Will not people who profit from Fed interventions do the same? Willy-nilly financial dirigisme will inevitably lead to politicization, cronyism, a sclerotic, uncompetitive financial system and political oversight. Meanwhile, increasing moral hazard and a greater conflagration are sure to follow when the Fed misdiagnoses the next crisis.
The U.S. experienced a financial crisis just a few years ago. Doesn't the country need the Fed to stop another one? Yes, but not this way. Instead, we need a robust financial system that can tolerate "bubbles" without causing "systemic" crises. Sharply limiting run-prone, short-term debt is a much easier project than defining, diagnosing and stopping "bubbles." [For more, see this previous post] That project is a hopeless quest, dripping with the unanticipated consequences of all grandiose planning schemes.
In the current debate over who will be the next Fed chair, we should not look for a soothsayer who will clairvoyantly spot trouble brewing, and then direct the tiniest details of financial flows. Rather, we need a human who can foresee the future no better than you and I, who will build a robust financial system as a regulator with predictable and limited powers.
*****
Bonus extras. A few of many delicious paragraphs cut for space.
Do not count on the Fed to voluntarily limit its bubble-popping, crisis management, or regulator discretion. Vast new powers come at an institutionally convenient moment. It’s increasingly obvious how powerless conventional monetary policy is. Four and a half percent of the population stopped working between 2008 and 2010, and the ratio has not budged since. GDP fell seven and a half percent below “potential,” in 2009 and is still six points below. Two trillion didn’t dent the thing, and surely another two wouldn’t make a difference either. How delicious, in the name of “systemic stability,” to just step in and tell the darn banks what to do, and be important again!
Ben Bernanke on macroprudential policy:
For example, a traditional microprudential examination might find that an individual financial institution is relying heavily on short-term wholesale funding, which may or may not induce a supervisory response. The implications of that finding for the stability of the broader system, however, cannot be determined without knowing what is happening outside that particular firm. Are other, similar financial firms also highly reliant on short-term funding? If so, are the sources of short-term funding heavily concentrated? Is the market for short-term funding likely to be stable in a period of high uncertainty, or is it vulnerable to runs? If short-term funding were suddenly to become unavailable, how would the borrowing firms react--for example, would they be forced into a fire sale of assets, which itself could be destabilizing, or would they cease to provide funding or critical services for other financial actors? Finally, what implications would these developments have for the broader economy? ...As if in our lifetimes anyone will have precise answers to questions like these. In case you didn't get the warning,
... And the remedies that might emerge from such an analysis could well be more far-reaching and more structural in nature than simply requiring a few firms to modify their funding patterns.A big thank you to my editor at WSJ, Howard Dickman, who did more than the usual pruning of prose and asking tough questions.
Friday, August 23, 2013
MOOC

So, if you're interested in the theory of academic asset pricing, or you've wanted to work through the book, here's your chance. It's designed for PhD students, aspiring PhD students, advanced MBAs, financial engineers, people who are working in industry who might like to study PhD level finance but don't have the time, and so on. It's not easy, we start with a stochastic calculus review! But I'm emphasizing the intuition, what the models mean, why we use them, and so on, over the mathematics.
Tuesday, July 30, 2013
On Au

I think Greg made two basic mistakes in analysis.
First, he assumed that returns (gold, bonds, stocks) are independent over time, so that one-period mean-variance analysis is the appropriate way to look at investments. Such analysis already makes it hard to understand why people hold so many long-term bonds. They don't earn much more than short term bonds, and have a lot more variance. But long-term bonds have a magic property: When the price goes down -- bad return today -- the yield goes up -- better returns tomorrow. Thus, because of their dynamic property (negative autocorrelation), long term bonds are risk free to long term investors even though their short-term mean-variance properties look awful.
Gold likely has a similar profile. Gold prices go up and down in the short run. But relative prices mean-revert in the long run, so the long run risk and short run risk are likely quite different.
Second, deeper, Greg forgot the average investor theorem. The average investor holds the value-weighted portfolio of all assets. And all deviations from market weights are a zero sum game. I can only earn positive alpha if someone else earns negative alpha. That's not a theorem, it's an identity. You should only hold something different than market weights if you are identifiably different than the market average investor. If, for example, you are a tenured professor, then your income stream is less sensitive to stock market fluctuations than other people, and that might bias you toward more stocks.
So, how does Greg analyze the demand for gold, and decide if he should hold more or less than market average weights? With mean-variance analysis. That's an instance of the answer, "I diverge from market weights because I'm smarter and better informed than the average investor." Now Greg surely is smarter than the average investor. But everyone else thinks they're smarter than average, and half of them are deluded.
In any case, Greg isn't smarter because he knows mean-variance analysis. In fact, sadly, the opposite is true. The first problem set you do in any MBA class (well, mine!) makes clear that plugging historical means and variance into a mean-variance optimizer and implementing its portfolio advice is a terrible guide to investing. Practically anything does better. 1/N does better. Means and variances are poorly estimated (Greg, how about a standard error?) and the calculation is quite unstable to inputs.
In any case, Greg shouldn't have phrased the question, "how much gold should I hold according to mean variance analysis, presuming I'm smarter than everyone else and can profit at their expense by looking in this crystal ball?" He should have phrased the question, "how much more or less than the market average should I hold?" And "what makes me different from average to do it?"
That's especially true of a New York Times op-ed, which offers investment advice to everyone. By definition, we can't all hold more or less gold than average! If you offer advice that A should buy, and hold more than average, you need to offer advice that B should sell, and hold less than average.
I don't come down to a substantially different answer though. As Greg points out, gold is a tiny fraction of wealth. So it should be at most a tiny fraction of a portfolio.
There is all this bit about gold, guns, ammo and cans of beans. If you think about gold that way, you're thinking about gold as an out of the money put option on calamitous social disruption, including destruction of the entire financial and monetary system. That might justify a different answer. And it makes a bit of sense why gold prices are up while TIPS indicate little expected inflation. But you don't value such options by one-period means and variances. And you still have to think why this option is more valuable to you than it is to everyone else.
Monday, July 22, 2013
Are we prepared for the next financial crisis?
This is the title of a very well-prepared video made by Hal Weitzman, Dustin Whitehead and the Booth "Capital Ideas" team, based on interviews with many of our faculty. Direct link here (Youtube)
Sunday, June 23, 2013
Stopping Bank Crises Before They Start
This is a Wall Street Journal Oped 6/24/2013
Regulating the riskiness of bank assets is a dead end. Instead, fix the run-prone nature of bank liabilities.
In recent months the realization has sunk in across the country that the 2010 Dodd-Frank financial-reform legislation is a colossal mess. Yet we obviously can't go back to the status quo that produced a financial catastrophe in 2007-08. Fortunately, there is an alternative.
At its core, the recent financial crisis was a run. The run was concentrated in the "shadow banking system" of overnight repurchase agreements, asset-backed securities, broker-dealers and investment banks, but it was a classic run nonetheless.
The run made the crisis. In the 2000 tech bust, people lost a lot of money, but there was no crisis. Why not? Because tech firms were funded by stock. When stock values fall you can't run to get your money out first, and you can't take a company to bankruptcy court.
This is a vital and liberating insight: To stop future crises, the financial system needs to be reformed so that it is not prone to runs. Americans do not have to trust newly wise regulators to fix Fannie Mae and Freddie Mac, end rating-agency shenanigans, clairvoyantly spot and prick "bubbles," and address every other real or perceived shortcoming of our financial system.
Runs are a pathology of financial contracts, such as bank deposits, that promise investors a fixed amount of money and the right to withdraw that amount at any time. A run also requires that the issuing institution can't raise cash by selling assets, borrowing or issuing equity. If I see you taking your money out, then I have an incentive to take my money out too. When a run at one institution causes people to question the finances of others, the run becomes "systemic," which is practically the definition of a crisis.
By the time they failed in 2008, Lehman Brothers and Bear Stearns were funding portfolios of mortgage-backed securities with overnight debt leveraged 30 to 1. For each $1 of equity capital, the banks borrowed $30. Then, every single day, they had to borrow 30 new dollars to pay off the previous day's loans.
When investors sniffed trouble, they refused to roll over the loans. The bank's broker-dealer customers and derivatives counterparties also pulled their money out, each also having the right to money immediately, but each contract also serving as a source of short-term funding for the banks. When this short-term funding evaporated, the banks instantly failed.
Clearly, overnight debt is the problem. The solution is just as clear: Don't let financial institutions issue run-prone liabilities. Run-prone contracts generate an externality, like pollution, and merit severe regulation on that basis.
Institutions that want to take deposits, borrow overnight, issue fixed-value money-market shares or any similar runnable contract must back those liabilities 100% by short-term Treasurys or reserves at the Fed. Institutions that want to invest in risky or illiquid assets, like loans or mortgage-backed securities, have to fund those investments with equity and long-term debt. Then they can invest as they please, as their problems cannot start a crisis.
Money-market funds that want to offer better returns by investing in riskier securities must let their values float, rather than promise a fixed value of $1 per share. Mortgage-backed securities also belong in floating-value funds, like equity mutual funds or exchange-traded funds. The run-prone nature of broker-dealer and derivatives contracts can also be reformed at small cost by fixing the terms of those contracts and their treatment in bankruptcy.
The bottom line: People who want better returns must transparently shoulder additional risk.
Some people will argue: Don't we need banks to "transform maturity" and provide abundant "safe and liquid" assets for people to invest in? Not anymore.
First, $16 trillion of government debt is enough to back any conceivable demand for fixed-value liquid assets. Money-market funds that hold Treasurys can expand to enormous size. The Federal Reserve should continue to provide abundant reserves to banks, paying market interest. The Treasury could offer reserves to the rest of us—floating-rate, fixed-value, electronically-transferable debt. There is no reason that the Fed and Treasury should artificially starve the economy of completely safe, interest-paying cash.
Second, financial and technical innovations can deliver the liquidity that once only banks could provide. Today, you can pay your monthly credit-card bill from your exchange-traded stock fund. Tomorrow, your ATM could sell $100 of that fund if you want cash, or you could bump your smartphone on a cash register to buy coffee with that fund. Liquidity no longer requires that anyone hold risk-free or fixed-value assets.
Others will object: Won't eliminating short-term funding for long-term investments drive up rates for borrowers? Not much. Floating-value investments such as equity and long-term debt that go unlevered into loans are very safe and need to pay correspondingly low returns. If borrowers pay a bit more than now, it is only because banks lose their government guarantees and subsidies.
In the 19th century, private banks issued currency. A few crises later, we stopped that and gave the federal government a monopoly on currency issue. Now that short-term debt is our money, we should treat it the same way, and for exactly the same reasons.
In the wake of Great Depression bank runs, the U.S. government chose to guarantee bank deposits, so that people no longer had the incentive to get out first. But guaranteeing a bank's deposits gives bank managers a huge incentive to take risks.
So we tried to regulate the banks from taking risks. The banks got around the regulations, and "shadow banks" grew around the regulated system. Since then we have been on a treadmill of ever-larger bailouts, ever-expanding government guarantees, ever-expanding attempts to regulate risks, ever-more powerful regulators and ever-larger crises.
This approach will never work. Rather than try to regulate the riskiness of bank assets, we should fix the run-prone nature of their liabilities. Fortunately, modern financial technology surmounts the economic obstacles that impeded this approach in the 1930s. Now we only have to surmount the obstacle of entrenched interests that profit from the current dysfunctional system.
Tuesday, June 18, 2013
Two seconds
The weekend wall street journal had an interesting article about high speed trading, Traders Pay for an Early Peek at Key Data. Through Thompson-Reuters, traders can get the University of Michigan consumer confidence survey results two seconds ahead of everyone else. They then trade S&P500 ETFs on the information.
Naturally, the article was about whether this is fair and ethical, with a pretty strong sense of no (and surely pressure on the University of Michigan not to offer the service.)
It didn't ask the obvious question: Traders need willing counterparties. Knowing that this is going on, who in their right mind is leaving limit orders on the books in the two seconds before the confidence surveys come out?
OK, you say, mom and pop are too unsophisticated to know what's going on. But even mom and pop place their orders through institutions which use trading algorithms to minimize price impact. It takes one line of code to add "do not leave limit orders in place during the two seconds before the consumer confidence surveys come out."
In short, the article leaves this impression that investors are getting taken. But it's so easy to avoid being taken, so it seems a bit of a puzzle that anyone can make money at this game.
I hope readers with more market experience than I can answer the puzzle: Who is it out there that is dumb enough to leave limit orders for S&P500 ETFs outstanding in the 2 seconds before the consumer confidence surveys come out?
 |
| Source: Wall Street Journal |
Naturally, the article was about whether this is fair and ethical, with a pretty strong sense of no (and surely pressure on the University of Michigan not to offer the service.)
It didn't ask the obvious question: Traders need willing counterparties. Knowing that this is going on, who in their right mind is leaving limit orders on the books in the two seconds before the confidence surveys come out?
OK, you say, mom and pop are too unsophisticated to know what's going on. But even mom and pop place their orders through institutions which use trading algorithms to minimize price impact. It takes one line of code to add "do not leave limit orders in place during the two seconds before the consumer confidence surveys come out."
In short, the article leaves this impression that investors are getting taken. But it's so easy to avoid being taken, so it seems a bit of a puzzle that anyone can make money at this game.
I hope readers with more market experience than I can answer the puzzle: Who is it out there that is dumb enough to leave limit orders for S&P500 ETFs outstanding in the 2 seconds before the consumer confidence surveys come out?
Thursday, June 6, 2013
Two on financial reform
I recently read two interesting items in the long-running financial regulation saga.
First, a very thoughtful, clear, and succinct speech by Philadelphia Fed President Charles Plosser titled "Reducing Financial Fragility by Ending Too Big to Fail." It's interesting to see a (another?) Fed President basically say that the whole Dodd-Frank / Basel structure is wrong-headed. Two little gems:
Second, Anat Admati and Martin Hellwig have an addition to their "Banker's new clothes" book (my review), 23 Flawed Claims Debunked. Don't miss the fun footnotes. Anat and Martin get some sort of medal for patience in wading through dreck.
First, a very thoughtful, clear, and succinct speech by Philadelphia Fed President Charles Plosser titled "Reducing Financial Fragility by Ending Too Big to Fail." It's interesting to see a (another?) Fed President basically say that the whole Dodd-Frank / Basel structure is wrong-headed. Two little gems:
There is probably no better example of rule writing that violates the basic principles of simple, robust regulation than risk-weighted capital calculations.No surprise, I agree.
...
Remember that Title II resolution is available only when there are concerns about systemic risk. Just imagine the highly political issue of determining whether a firm is systemically important, especially if it has not been designated so by the Financial Stability Oversight Committee beforehand....
...Creditors will perceive that their payoffs will be determined through a regulatory resolution process, which could be influenced through political pressure rather than subject to the rule of law
Second, Anat Admati and Martin Hellwig have an addition to their "Banker's new clothes" book (my review), 23 Flawed Claims Debunked. Don't miss the fun footnotes. Anat and Martin get some sort of medal for patience in wading through dreck.
Friday, May 17, 2013
More Interest-Rate Graphs
For a talk I gave a week or so ago, I made some more interest-rate graphs. This extends the last post on the subject. It also might be useful if you're teaching forward rates and expectations hypothesis.
The question: Are interest rates going up or down, especially long term rates? Investors obviously care, they want to know whether they should put money in long term bonds vs. short term bonds. As one who worries about debt and inflation, I'm also sensitive to the criticism that market rates are very low, forecasting apparently low rates for a long time. Yes, markets never see bad times coming, and markets 3 years ago got it way wrong thinking rates would be much higher than they are today (see last post) but still, markets don't seem to worry.
But rather than talk, let's look at the numbers. I start with the forward curve. The forward rate is the "market expectation" of interest rates, in that it is the rate you can contract today to borrow in the future. If you know better than the forward rate, you can make a lot of money.

Here, I unite the recent history of interest rates together with forecasts made from today's forward curve. The one year rate (red) is just today's forward curve. I find the longer rates as the average of the forward curves on those dates. Today's forward curve is the market forceast of the future forward curve too, so to find the forecast 5 year bond yield in 2020, I take the average of today's forward rates for 2020, 2021,..2024.
I found it rather surprising just how much, and how fast, markets still think interest rates will rise. (Or, perhaps, how large the risk premium is. If you know enough to ask about Q measure or P measure, you know enough to answer your own question.)
How can the forecast rise faster than the actual long term yields? Well, remember that long yields are the average of expected future short rates, and if short rates are below today's 10 year rate for 5 years, then they must be above today's 10 year rate for another 5 years. So, it's a misconception to read from today's 2% 10 year rate that markets expect interest rates to be 2% in the future. Markets expect a rise to 4% within 10 years.
 The forward curve has the nice property that if interest rates follow this forecast, then returns on bonds of all maturities are always exactly the same. The higher yields of long-term bonds exactly compensate for the price declines when interest rates rise. I graphed returns on bonds of different maturities here to make that point.
So, Mr. Bond speculator, if you believe the forecast in the first graph, it makes absolutely no difference whether you buy long or short. Otherwise, decide whether you think rates will rise faster or slower than the forward curve.
Now, let's think about other scenarios. One possibility is Japan. Interest rates get stuck at zero for a decade. This would come with sclerotic growth, low inflation, and a massive increase in debt, as it has in Japan. Eventually that debt is unsustainable, but as Japan shows, it can go on quite a long time. What might that look like?
 Here is a "Japan scenario." I set the one year rate to zero forever. I only changed the level of the market forecast, however, not the slope. Thus, to form the expected forward curve in 2020, I shifted today's forward curve downwards so that the 2020 rate is zero, but other rates rise above that just as they do now.
This scenario is another boon to long term bond holders. They already got two big presents. Notice the two upward camel-humps in long term rates -- those were foreasts of rate risks that didn't work out, and people who bought long term bonds made money.
 In a Japan scenario that happens again. Holders of long-term government bonds rejoice at their 2% yields. They get quite nice returns, shown left, as rates fail to rise as expected and the price of their bonds rises. Until the debt bomb explodes.

OK, what if things go the other way? What would an unexpectedly large rise in interest rates look like?
For example Feburary 1994 looked a lot like today, and then rates all of a sudden jumped up when the Fed started tightening.

To generate a 1994 style scenario from today's yields, I did the opposite of the Japan scenario. I took today's forward curve and added 1%, 2%, 3% and 4% to the one-year rate forecast. As with the Japan scenario, I shifted the whole forward curve up on those dates. We'll play with forward steepness in a moment.
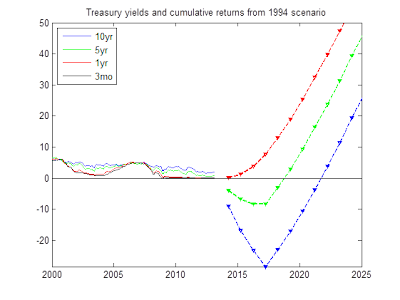 Here are cumulative returns from the 1994 scenario. Long term bonds take a beating, of course. Returns all gradually rise, as interest rates rise. (These are returns to strategies that keep a constant maturity, i.e. buy a 10 year bond, sell it next year as a 9 year bond, buy a new 10 year bond, etc)
These have been fun, but I've only changed the level of the forward curve forecast, not the slope. Implicitly, I've gone along with the idea that the Fed controls everything about interest rates. If you worry, as I do, you worry that long rates can go up all on their own. Japan's 10 year rate has been doing this lately. When markets lose faith, long rates rise. Central bankers see "confidence" or "speculators" or "bubbles" or "conundrums." What does that look like?

To generate a "steepening" scenario, I imagined that markets one year from now decide that interest rates in 2017 will spike up 5 percentage points. This may be a "fear" not an "expectation," i.e. a rise in risk premium.
Then, the 5 and 10 year rates rise immediately, even though the Fed (red line) didn't do anything to the one-year rate. The bond market vigilantes stage a strike on long term debt.

Here are the consequences for cumulative returns of my steepening scenario. The long term bonds are hit much more than the shorter term bonds. This really is a bloodbath for 10 year and higher investors, leaving those under 5 years much less hurt.
So what will happen? I don't know, I don't make forecasts. But I do think it's useful to generate some vaguely coherent scenarios. The forward curve is not a rock solid this is what will happen forecast. The forward curve adds up all of these possiblities, with probabilities assigned to each, plus risk premium. There is a lot of uncertainty, and good portfolio formation starts with risk management not chasing alpha.
The question: Are interest rates going up or down, especially long term rates? Investors obviously care, they want to know whether they should put money in long term bonds vs. short term bonds. As one who worries about debt and inflation, I'm also sensitive to the criticism that market rates are very low, forecasting apparently low rates for a long time. Yes, markets never see bad times coming, and markets 3 years ago got it way wrong thinking rates would be much higher than they are today (see last post) but still, markets don't seem to worry.
But rather than talk, let's look at the numbers. I start with the forward curve. The forward rate is the "market expectation" of interest rates, in that it is the rate you can contract today to borrow in the future. If you know better than the forward rate, you can make a lot of money.

Here, I unite the recent history of interest rates together with forecasts made from today's forward curve. The one year rate (red) is just today's forward curve. I find the longer rates as the average of the forward curves on those dates. Today's forward curve is the market forceast of the future forward curve too, so to find the forecast 5 year bond yield in 2020, I take the average of today's forward rates for 2020, 2021,..2024.
I found it rather surprising just how much, and how fast, markets still think interest rates will rise. (Or, perhaps, how large the risk premium is. If you know enough to ask about Q measure or P measure, you know enough to answer your own question.)
How can the forecast rise faster than the actual long term yields? Well, remember that long yields are the average of expected future short rates, and if short rates are below today's 10 year rate for 5 years, then they must be above today's 10 year rate for another 5 years. So, it's a misconception to read from today's 2% 10 year rate that markets expect interest rates to be 2% in the future. Markets expect a rise to 4% within 10 years.
 The forward curve has the nice property that if interest rates follow this forecast, then returns on bonds of all maturities are always exactly the same. The higher yields of long-term bonds exactly compensate for the price declines when interest rates rise. I graphed returns on bonds of different maturities here to make that point.
So, Mr. Bond speculator, if you believe the forecast in the first graph, it makes absolutely no difference whether you buy long or short. Otherwise, decide whether you think rates will rise faster or slower than the forward curve.
Now, let's think about other scenarios. One possibility is Japan. Interest rates get stuck at zero for a decade. This would come with sclerotic growth, low inflation, and a massive increase in debt, as it has in Japan. Eventually that debt is unsustainable, but as Japan shows, it can go on quite a long time. What might that look like?

This scenario is another boon to long term bond holders. They already got two big presents. Notice the two upward camel-humps in long term rates -- those were foreasts of rate risks that didn't work out, and people who bought long term bonds made money.


OK, what if things go the other way? What would an unexpectedly large rise in interest rates look like?
For example Feburary 1994 looked a lot like today, and then rates all of a sudden jumped up when the Fed started tightening.

To generate a 1994 style scenario from today's yields, I did the opposite of the Japan scenario. I took today's forward curve and added 1%, 2%, 3% and 4% to the one-year rate forecast. As with the Japan scenario, I shifted the whole forward curve up on those dates. We'll play with forward steepness in a moment.

These have been fun, but I've only changed the level of the forward curve forecast, not the slope. Implicitly, I've gone along with the idea that the Fed controls everything about interest rates. If you worry, as I do, you worry that long rates can go up all on their own. Japan's 10 year rate has been doing this lately. When markets lose faith, long rates rise. Central bankers see "confidence" or "speculators" or "bubbles" or "conundrums." What does that look like?

To generate a "steepening" scenario, I imagined that markets one year from now decide that interest rates in 2017 will spike up 5 percentage points. This may be a "fear" not an "expectation," i.e. a rise in risk premium.
Then, the 5 and 10 year rates rise immediately, even though the Fed (red line) didn't do anything to the one-year rate. The bond market vigilantes stage a strike on long term debt.

Here are the consequences for cumulative returns of my steepening scenario. The long term bonds are hit much more than the shorter term bonds. This really is a bloodbath for 10 year and higher investors, leaving those under 5 years much less hurt.
So what will happen? I don't know, I don't make forecasts. But I do think it's useful to generate some vaguely coherent scenarios. The forward curve is not a rock solid this is what will happen forecast. The forward curve adds up all of these possiblities, with probabilities assigned to each, plus risk premium. There is a lot of uncertainty, and good portfolio formation starts with risk management not chasing alpha.
Wednesday, May 8, 2013
Finance: Function Matters, not Size
"Finance: Function Matters, not Size" This is the new title of the published version of "The Size of Finance," which I posted on this blog here as a working paper. If you enjoyed the original, here is the better final version. If you didn't, here it is all fresh and new.
Published version (my webpage)
Published version (Journal of Economic Perspectives)
Growth of the Financial Sector" symposium (Journal of Economic Perspectives)
Published version (my webpage)
Published version (Journal of Economic Perspectives)
Growth of the Financial Sector" symposium (Journal of Economic Perspectives)
Saturday, May 4, 2013
Floating-rate Treasury debt
Last week the Treasury announced that is it going ahead with floating-rate debt, and gave some details how it will work. The Wall Street Journal coverage is here and the Treasury announcement is here. I wrote about the issue at some length last fall, here (And freely admit some of today's essay repeats points made there.)
Right now, the Treasury rolls over a lot of debt. For example, about one and a half trillion dollars is in the form of Treasury bills, which mature in less than a year. So, every year, the Treasury sells one and a half trillion dollars of new bills, which it uses to pay off one and a half trillion dollars of old bills.
With floating-rate debt, all the buying and selling is avoided. Instead, the Treasury periodically sets a new rate, so that the floating rate security has value one dollar (just as the maturing bill would have). It's the same thing, except the bill sits in the investor's pocket.
When interest rates go up, fixed-coupon long term debt falls in price. Floating-rate debt does not -- the interest payment goes up, so that the value of the debt is stable. Thus, even though its maturity may be long -- the Treasury mentioned two years -- the value of the debt is as safe as that of very short-term debt.
Homeowners are familiar with the system. An adjustable rate mortgage works the same way. You could take out a one-year balloon mortgage and refinance every year. But the adjustable rate is a lot simpler .
Now, I'm usually a Modigliani-Miller fan, and from the point of view of frictionless finance, it doesn't make any difference whether the Treasury has floating rate debt or rolls over debt. So why do I like this so much?
As a minor benefit, floating rate debt is just a little bit safer. It is possible that markets refuse to roll over debt, leaving the Treasury technically insolvent, unable to pay the principal on its existing debt. This is basically what happened in Greece. With floating rate debt, the Treasury would still face a crisis, unable to borrow new money, and forced next month to pay huge interest on the floating rate debt. But at least the crisis would be averted a bit and not result in immediate default. This is a very unlikely circumstance, you say, and I agree, but we all thought the last financial crisis was unlikely too until it happened.
A deeper benefit, I think, is that floating-rate Treasury debt opens the way to a run-free financial system. I want huge capital requirements on banks for all assets except floating-rate or short term Treasury debt. And I don't like runs in money market funds.
The usual answer is, "that's nice, but people need lots of safe securities. We need banks and money market funds holding risky securities to intermediate to provide the vast amount of safe securities people want. You have to put up with runs, TBTF guarantees, massive regulation and so on."
Well, suppose the Treasury were to fund itself entirely by floating rate debt. We could have $11 trillion of floating-rate debt, generating $11 trillion of perfectly safe money-market fund assets. We can be awash in fixed-value assets, and could happily ban the rest, largely eliminating run-prone assets from the financial system.
(What about the interest rate risk, you ask? Didn't I just advocate the opposite, that Treasury needs to issue longer-term debt? Yes, but the Treasury can swap out the interest rate risk with fixed-for-floating swaps. Who will buy those swaps? The same people who are buying long-term Treasuries now. Of course, I also suspect that in addition to the Fed's $3 trillion of interest-paying reserves, which are also floating-rate US government debt, the demand will not be more than a few trillion.)
My complaint though (you knew I'd complain, no?) is that Treasury did not go far enough. The proposal says that the Treasury will pay a rate determined by an index,
I would much rather that the Treasury pegged the value to exactly $100 at all times, buying and selling at that price between auctions, and using direct auctions to reset the rate every month or so.
Why? The alleged "safe asset" demand is for assets with absolutely fixed value. This is why money market funds and their customers are howling about proposals to let values float. With these floating-rate bonds as assets, we will still need money market funds or narrow banks to intermediate, and provide assets with truly fixed values, wiping out a few tens of precious basis points for the end customer in the process (and tempting that customer to "reach for yield" and get us back in to trouble again).
If the Treasury issued fixed-value floating-rate debt, in small denominations, electronically transferable, we might not need such funds at all. Or, they would have to compete on providing better IT services for retail customers (likely!) rather than managing the small price fluctuations of floating-rate Treasury assets. The Treasury says it wants to broaden the investor base. Well, the "Treasury money market fund" open to retail investors like you and me is the broadest base it can imagine!
The Treasury may be deliberately avoiding this outcome, to keep money market funds in business (i.e. to provide them with a little artificial profit), as the Fed kept the Federal funds rate 10 bp or so above zero to keep such funds in business. But if funds need an artificially hobbled government security to stay in business, we should let them vanish.
I think the Treasury should also make them perpetual. The proposal says the floaters will have a two-year maturity, forcing owners to cash in principal and buy new again, and Treasury to refinance. Why? Why not make this just like a money market account -- floating rate perpetuities? Big enough surpluses so that the Treasury has to buy back perpetuities are a long way away!
In sum, A- Treasury! But, instead of indexing, fix the price at $100 at all times, using an auction to reset rates; make them available in small denominations to regular investors with easy electronic transfers; and lengthen the maturity. A lot.
Then we can start clamping down on all the stuff that blew up in 2008.
Right now, the Treasury rolls over a lot of debt. For example, about one and a half trillion dollars is in the form of Treasury bills, which mature in less than a year. So, every year, the Treasury sells one and a half trillion dollars of new bills, which it uses to pay off one and a half trillion dollars of old bills.
With floating-rate debt, all the buying and selling is avoided. Instead, the Treasury periodically sets a new rate, so that the floating rate security has value one dollar (just as the maturing bill would have). It's the same thing, except the bill sits in the investor's pocket.
When interest rates go up, fixed-coupon long term debt falls in price. Floating-rate debt does not -- the interest payment goes up, so that the value of the debt is stable. Thus, even though its maturity may be long -- the Treasury mentioned two years -- the value of the debt is as safe as that of very short-term debt.
Homeowners are familiar with the system. An adjustable rate mortgage works the same way. You could take out a one-year balloon mortgage and refinance every year. But the adjustable rate is a lot simpler .
Now, I'm usually a Modigliani-Miller fan, and from the point of view of frictionless finance, it doesn't make any difference whether the Treasury has floating rate debt or rolls over debt. So why do I like this so much?
As a minor benefit, floating rate debt is just a little bit safer. It is possible that markets refuse to roll over debt, leaving the Treasury technically insolvent, unable to pay the principal on its existing debt. This is basically what happened in Greece. With floating rate debt, the Treasury would still face a crisis, unable to borrow new money, and forced next month to pay huge interest on the floating rate debt. But at least the crisis would be averted a bit and not result in immediate default. This is a very unlikely circumstance, you say, and I agree, but we all thought the last financial crisis was unlikely too until it happened.
A deeper benefit, I think, is that floating-rate Treasury debt opens the way to a run-free financial system. I want huge capital requirements on banks for all assets except floating-rate or short term Treasury debt. And I don't like runs in money market funds.
The usual answer is, "that's nice, but people need lots of safe securities. We need banks and money market funds holding risky securities to intermediate to provide the vast amount of safe securities people want. You have to put up with runs, TBTF guarantees, massive regulation and so on."
Well, suppose the Treasury were to fund itself entirely by floating rate debt. We could have $11 trillion of floating-rate debt, generating $11 trillion of perfectly safe money-market fund assets. We can be awash in fixed-value assets, and could happily ban the rest, largely eliminating run-prone assets from the financial system.
(What about the interest rate risk, you ask? Didn't I just advocate the opposite, that Treasury needs to issue longer-term debt? Yes, but the Treasury can swap out the interest rate risk with fixed-for-floating swaps. Who will buy those swaps? The same people who are buying long-term Treasuries now. Of course, I also suspect that in addition to the Fed's $3 trillion of interest-paying reserves, which are also floating-rate US government debt, the demand will not be more than a few trillion.)
My complaint though (you knew I'd complain, no?) is that Treasury did not go far enough. The proposal says that the Treasury will pay a rate determined by an index,
We have decided to use the weekly High Rate of 13-week Treasury bill auctions, which was described in the ANPR, as the index for Treasury FRNs.This means that the price of the floating-rate notes will deviate somewhat from par ($100.)
I would much rather that the Treasury pegged the value to exactly $100 at all times, buying and selling at that price between auctions, and using direct auctions to reset the rate every month or so.
Why? The alleged "safe asset" demand is for assets with absolutely fixed value. This is why money market funds and their customers are howling about proposals to let values float. With these floating-rate bonds as assets, we will still need money market funds or narrow banks to intermediate, and provide assets with truly fixed values, wiping out a few tens of precious basis points for the end customer in the process (and tempting that customer to "reach for yield" and get us back in to trouble again).
If the Treasury issued fixed-value floating-rate debt, in small denominations, electronically transferable, we might not need such funds at all. Or, they would have to compete on providing better IT services for retail customers (likely!) rather than managing the small price fluctuations of floating-rate Treasury assets. The Treasury says it wants to broaden the investor base. Well, the "Treasury money market fund" open to retail investors like you and me is the broadest base it can imagine!
The Treasury may be deliberately avoiding this outcome, to keep money market funds in business (i.e. to provide them with a little artificial profit), as the Fed kept the Federal funds rate 10 bp or so above zero to keep such funds in business. But if funds need an artificially hobbled government security to stay in business, we should let them vanish.
I think the Treasury should also make them perpetual. The proposal says the floaters will have a two-year maturity, forcing owners to cash in principal and buy new again, and Treasury to refinance. Why? Why not make this just like a money market account -- floating rate perpetuities? Big enough surpluses so that the Treasury has to buy back perpetuities are a long way away!
In sum, A- Treasury! But, instead of indexing, fix the price at $100 at all times, using an auction to reset rates; make them available in small denominations to regular investors with easy electronic transfers; and lengthen the maturity. A lot.
Then we can start clamping down on all the stuff that blew up in 2008.
Wednesday, April 10, 2013
Interest rate graphs
Where are interest rates going? Here are two fun graphs I made, for a talk I gave Tuesday at Grant's spring conference, on this question. (Full slide deck here or from link on my webpage here)

Here is a graph of the recent history of interest rates. (These are constant maturity Treasury yields from the Fed) You can see the pattern:
Early in a recession, interest rates fall, but long rates stay above short rates. These are great times for holders of long-term bonds. They get higher yields, but prices also rise as rates fall, so they make money both ways. But you also see the see-saws. Interpretation: long-term bond holders are getting a premium for holding interest rate risk at a time that nobody wants to hold risks.
Then there is the flat part at the bottom of the recession. Now long-term bond holders get the yield, but interest rates don't change. Still, they're making money.
Then comes the interest rate rise, when long-term bond holders lose money. Obviously, you want to get out before interest rates start rising. But it's not easy. Nobody knows for sure how long recessions will last. (That seems to be the lesson of more serious work too.) Look at all the fits and starts, all the zig zags in long interest rates. You don't want to be caught napping like in 1994. But if you, like me, thought last year or the year before looked like 1994, you got out too early. Welcome to risk and return. Notice in 2003 that long rates started rising long before the Fed did anything.
As I look at the fundamentals, current rates look pretty low. Will inflation really average less than 3% for the next 30 years, so you just break even on 30 year bonds? But the criticism, "if we're in such trouble, why don't markets see it coming?" is still troublesome. So let's look at the actual market forecast
 The solid blue line and red line are today's yield curve and forward curve. (This is the Gürkaynak, Sack, and Wright data). The blue forward curve is the market expectation of where interest rates will go in the future. You can lock in these rates today, so if you really know something different is going to happen, you can make a fortune. (This is why I'm not persuaded by arguments that the Fed is driving down rates below market expectations.) We can interpret this blue forward curve by the "consensus forecast." The economy slowly recovers, interest rates slowly rise back to normal levels (4%) consistent with 2% inflation and 2% real rates. The fall back to 3% rates at the long end of the curve seems a bit low, but that's the market forecast and always a good place to start prognosticating.
If the path of future interest rates follows the blue forward curve, there is no bloodbath in long term bonds: you earn this rate of return on bonds of all maturity at every date going forward. (Proving this is a good finance class problem.)
How good are market forecasts though? This may be the market's best guess, but a lot of the future is simply unknowable. The thin blue and red lines show the forward curve and yield curve in April 2010. You can see that at the time, the consensus market forecast was for interest rates to rise starting sooner, and to rise more quickly. We all expected the recession to end quickly, as recessions usually do.
In 2010, the market forecast that today's interest rate would be 3.5%, not zero. I graphed that forecast and realization by the leftmost vertical arrow. Furthermore, the entire forward curve forecasts the entire forward curve. So, second point from the left, in 2010 the market forecast that today's one-year forward rate would be about 4.2%, not the tenth of a percent or so that we see. If the forward rate forecast is correct, today's forward rate curve should lie exactly on the 2010 forward curve. (Proving that is another nice problem set question for finance classes.)
So, from the perspective of 2010, we have seen quite a large, surprise, downward shift of the "market expectations" in the forward curve. It has been a great few years for holders of long term bonds.
However, beware: What goes down can come up again. To those who say "interest rates are low, the market doesn't see trouble coming, why worry?" I think the graph shows the magnitude of interest rate risk. And risk goes in both directions.
So, I'm still doom and gloomy. But the danger we face is unpredictable. Large debts mean that the government is out of ammunition, didn't pay the insurance bill, the fire extinguishers are empty, we are prone to a run or a sovereign debt "bubble" bursting (I hate that word, but I think it conveys the spirit), choose your anecdote. We could have a Japanese decade. It could be February 1994, when spreads and recent history looked a lot like today's. Or we could be on the edge of Greece, whose interest rates were pretty low once upon a time as well. The market forecast interpolates between these options.
The first principle of portfolio maximization is risk management, not prognostication. There remains a lot of risk.

Here is a graph of the recent history of interest rates. (These are constant maturity Treasury yields from the Fed) You can see the pattern:
Early in a recession, interest rates fall, but long rates stay above short rates. These are great times for holders of long-term bonds. They get higher yields, but prices also rise as rates fall, so they make money both ways. But you also see the see-saws. Interpretation: long-term bond holders are getting a premium for holding interest rate risk at a time that nobody wants to hold risks.
Then there is the flat part at the bottom of the recession. Now long-term bond holders get the yield, but interest rates don't change. Still, they're making money.
Then comes the interest rate rise, when long-term bond holders lose money. Obviously, you want to get out before interest rates start rising. But it's not easy. Nobody knows for sure how long recessions will last. (That seems to be the lesson of more serious work too.) Look at all the fits and starts, all the zig zags in long interest rates. You don't want to be caught napping like in 1994. But if you, like me, thought last year or the year before looked like 1994, you got out too early. Welcome to risk and return. Notice in 2003 that long rates started rising long before the Fed did anything.
As I look at the fundamentals, current rates look pretty low. Will inflation really average less than 3% for the next 30 years, so you just break even on 30 year bonds? But the criticism, "if we're in such trouble, why don't markets see it coming?" is still troublesome. So let's look at the actual market forecast

If the path of future interest rates follows the blue forward curve, there is no bloodbath in long term bonds: you earn this rate of return on bonds of all maturity at every date going forward. (Proving this is a good finance class problem.)
How good are market forecasts though? This may be the market's best guess, but a lot of the future is simply unknowable. The thin blue and red lines show the forward curve and yield curve in April 2010. You can see that at the time, the consensus market forecast was for interest rates to rise starting sooner, and to rise more quickly. We all expected the recession to end quickly, as recessions usually do.
In 2010, the market forecast that today's interest rate would be 3.5%, not zero. I graphed that forecast and realization by the leftmost vertical arrow. Furthermore, the entire forward curve forecasts the entire forward curve. So, second point from the left, in 2010 the market forecast that today's one-year forward rate would be about 4.2%, not the tenth of a percent or so that we see. If the forward rate forecast is correct, today's forward rate curve should lie exactly on the 2010 forward curve. (Proving that is another nice problem set question for finance classes.)
So, from the perspective of 2010, we have seen quite a large, surprise, downward shift of the "market expectations" in the forward curve. It has been a great few years for holders of long term bonds.
However, beware: What goes down can come up again. To those who say "interest rates are low, the market doesn't see trouble coming, why worry?" I think the graph shows the magnitude of interest rate risk. And risk goes in both directions.
So, I'm still doom and gloomy. But the danger we face is unpredictable. Large debts mean that the government is out of ammunition, didn't pay the insurance bill, the fire extinguishers are empty, we are prone to a run or a sovereign debt "bubble" bursting (I hate that word, but I think it conveys the spirit), choose your anecdote. We could have a Japanese decade. It could be February 1994, when spreads and recent history looked a lot like today's. Or we could be on the edge of Greece, whose interest rates were pretty low once upon a time as well. The market forecast interpolates between these options.
The first principle of portfolio maximization is risk management, not prognostication. There remains a lot of risk.
Saturday, January 19, 2013
Is Finance Too Big?
Is finance too big? Here's a draft essay on the subject. There is a pdf on my webpage, and updates, revisions and a final version will end up there.
This came about as a "response essay" to Robin Greenwood and David Scharfstein's "The growth of modern finance" for the Journal of Economic Perspectives. That's why Robin and David are the target of a lot of criticism. But they're really just standing in for a lot of opinion that finance is "too big," in part because they did such a good and evenhanded job of synthesizing that point of view. So, sorry for picking on you, Robin and David!
I'm sure the JEP will make me cut it down and tone it down, so this is the fun first draft.
Is Finance Too Big?
John H. Cochrane [1],[2]
January 7 2013
I. Introduction
The US spends $150 billion a year on advertising and marketing[3]. $150 billion, just to trick people into buying stuff they don’t need. What a waste.
There are 2.2 people doing medical billing for every doctor that actually sees patients, costing $360 billion[4] -- 2.4% of GDP. Talk about “too big!”
Wholesale, retail trade and transportation cost 14.6% of GDP, while all manufacturing is only 11.5% of GDP. We spend more to move stuff around than to make it!
A while ago, my wife asked me to look at light fixtures. Have you seen how many thousands of different kinds of light fixtures there are? The excess complexity is insane. Ten ought to be plenty.
It’s ridiculous how much people overpay for brand names when they can get the generic a lot cheaper. They must be pretty naive.
Business school finance professors are horribly overpaid. Ask an anthropologist! We must really have snowballed university administrations to get paid nearly half a million bucks, and work a grand total of 10 weeks a year, all to teach students that there is no alpha to be made in the stock market.
Did you know that Kim Kardashian gets $600,000 just to show up at a nightclub in Vegas? How silly is that?
It’s a lot of fun to pass judgment on “social benefits,” “size,” “complexity” of industry, and “excessive compensation” of people who get paid more than we do, isn’t it? But it isn’t really that productive either.
As economists we have a structure for thinking about these questions.
We start with the first welfare theorem: loosely, supply, demand and competition lead to socially beneficial arrangements. Yet the world around often doesn’t obviously conform to simple supply and demand arguments. See above. Then, we embark on a three-pronged investigation: First, maybe there is something about the situation we don’t understand. Durable institutions and arrangements, despite competition and lack of government interference, sometimes take us years to understand. Second, maybe there is a “market failure,” an externality, public good, natural monopoly, asymmetric information, or missing market, that explains our puzzle. Third, we often discover a “government failure,” that the puzzling aspect of our world is an unintended consequence of law or regulation. The regulators got captured, the market innovated around a regulation, or legal restrictions stop supply and demand from working.
Once we understand a puzzle, we are in a position to begin to diagnose a divergence between reality and socially desirable outcomes, and we can start to think of how to improve the outcome. But, though “some” may the world puzzling, or “many” might “voice concerns,” we don’t pronounce until we understand how one of these mechanisms describes the situation. Quantitatively: Cocktail-party externalities need not apply.
“I don’t understand it” doesn’t mean “it’s bad.” And since that attitude pervades regulation in general and financial regulation in particular, we do the world a disservice if we echo it.
I belabor this point, because I do not offer a competing black box. I don’t claim to estimate the socially-optimal “size of finance” at 8.267% of GDP, so there. Though apparently rhetorically effective, this is simply not how we do economics. After all, if a bunch of academics could sit around our offices and decide which industries were “too big,” which ones were “too small,” and close our papers with “policy recommendations” to remedy the matter, central planning would have worked. A little Hayekian modesty suggests we focus on documenting the distortions, not pronouncing on optimal industry sizes. Documenting distortions has also been, historically, far more productive than pronouncing on the optimal size of industries, optimal compensation of executives, “global imbalances,” “savings gluts,” “excessive consumption,” or other outcomes.
Furthermore, when we think about the social costs and benefits of finance, at this point in our history, it seems a bit strange to be arguing whether 5% or 8% of GDP is the right “size” of finance. Looking back, I think that we would all happily accept 3% extra GDP in return for a financial system that is not prone to runs and crises. We are accepting a big increase in resources devoted to financial regulation and compliance, and a potentially larger reduction in the efficiency, innovation, and competitiveness of financial institutions and markets, in an attempt (misguided or not) to avoid runs and crises. And the run-prone nature of our financial system, together with consequently massive regulation and government guarantees, look like more fertile fishing ground for market and government failures than does mere size. Looking forward, insulating the financial system from sovereign default seems like a much more pressing issue than thinking of regulations to increase or reduce its “size.”
Still, the size of finance represents a contentious issue, so let us think about it.
The financial services industry has grown a lot, reaching 8% of GDP. Greenwood and Scharfstein (2012) usefully focus the discussion by identifying the two areas of most significant revenue growth: asset management and fees associated with the expansion and refinancing of household debt.
The asset management story is straightforward:
I won’t delve much into numbers, except to point out how hard measurement is. The difference between GDP, revenue, wages, employees, value added, etc. matters. We really want to know how many resources are devoted to the function of finance, but GDP is based on industry. If a steel company runs its pension fund investments in-house, that activity is counted as part of the steel industry GDP. If the steel company hires an asset management company to run its pension fund investments, now that same activity shows up as finance industry GDP. If an individual shifts his investments to a mutual fund, his investment management activity shifts from home production, not counted at all, to market activity. GDP shows a larger finance industry, though overall resources devoted to money management may decline. And data on the size of finance that ends in 2007 leads to an obvious retort – like the weather, if you don’t like it, just wait a bit.
Instead, let us take the broad brush of facts as Greenwood and Scharfstein have summarized them and think about how we should interpret those facts. (I pick on Greenwood and Scharfstein’s interpretations, but this isn’t really a comment on their paper. Their interpretations are a well-stated representative of a larger academic literature, especially Phillippon (2008), and a much larger public and policy debate. Greenwood and Scharfstein merely make a concise and specific reference point for a broader discussion.)
As Greenwood and Scharfstein note, there are many obviously beneficial aspects to the growth of finance over the last 40 years. My grandfather held individual shares of stock. I hold a share of the Vanguard total market index in a 401(k) plan, a much better diversified and much lower-cost form of investment. The much larger participation, diversification, and consequent risk-sharing, plausibly has led not only to better retirement savings opportunities, but to halving of the cost of capital for businesses that issue equity – price/earnings ratios seem to be on a permanently higher plateau, or at least so we hope. The accessibility of housing, student, and consumer finance has become if anything too easy. Let’s instead focus on the contentious issues.
Their basic facts seem to scream: The demand for financial services shifted out. People with scarce skills supplying such services made a lot of money. (Portfolio managers, yes. Janitors and secretaries, no.) A system with proportional fees, a common structure in professional services, interacted with stock and home price increases (a different surge in demand) to produce increased revenue. That fee rates did not fall seems hardly surprising when faced with a surge in demand. Why demand shifted out, and why house and stock prices rose (temporarily, it turns out) are good questions. But they don’t have much to do with the structure of the finance industry.
Still, let us dig deeper. In particular, I wish to trace what the voluminous recent literature in finance implies for the “size” and “social benefits” question.
II. Active management and fees
a. The traditional view
High-fee active management and underlying active trading has been deplored by academic finance in the efficient-markets tradition for a generation. French (2008) is a comprehensive summary. French estimates that equity investors in aggregate, between 1980 and 2006, paid 0.67% per year in active management fees, which conservatively means 10% of the value of their investments.
French, and Greenwood and Scharfstein, note that the increase in management fee revenue lies on top of several offsetting trends. Individuals moved investments from direct holdings to mutual funds, and then to index or other passive and semi-passive funds[5]. Their participation overall increased, and new investors in defined-contribution plans invest almost exclusively in funds.
Mutual fund fee rates, came down sharply, in part reflecting the slow spread of very low-fee index and other passive funds, and in part simply reflecting competitive pressure. French reports that the average equity fund fee fell from 2.19% in 1980 to 1% in 2007. Greenwood and Scharfstein report that average bond fund fees fell from 2.04% to 0.75% Some index funds charge as little as 0.07% .
Total mutual fund fee revenues reflect these declining rates multiplied by a much larger share of assets under management. So, the behavior of individuals and funds oriented towards individuals does reflect sensible forces, if one is willing to grant a rather long time span for those forces to affect industry structure.
High-wealth individuals and institutions moved their investments to even more actively-managed hedge funds, private equity, venture capital, and other even higher-fee and more active investment vehicles. Hedge fund fee rates are reportedly stable over time with 1.5-2.5% management fee plus 15-25% “performance” fee; the fund managers keep 15-25% of the profits above a high-water mark. This part of the market surely offers the more puzzling behavior. Asness (2004) chalks fee stability up to supply and demand: more investors are looking for hedge funds (with great track records) than entrepreneurs are able to set up such funds.
That would all make some sense if investors were getting something for those fees. But the aggregate portfolio of equity mutual funds is almost exactly the value-weighted market portfolio, and the average alpha[6] before fees is very nearly zero. (Fama and French (2010) is an excellent tip of this iceberg of research.) The evidence from hedge funds, which struggles with much worse survivor-bias and multidimensional benchmarking issues, still ends up arguing over a few percentage points of alpha one way or the other, hardly the expected gold mine.
Mediocre average results might not be surprising. With free entry in any business, the average performer will be average. The average economics professor isn’t that good either. But one might expect that, as in every other field of human endeavor, the good managers would be reliably good. Every manager I’ve ever talked to responds “Sure, the average manager doesn’t know what he’s doing. But we have alpha.” Michael Jordan’s past performance was a reliable indication of what would happen in the next game.
In this context, Fama and French’s (2010) more surprising finding is that the distribution of alpha is remarkably small. The sample of mutual fund alpha is only very slightly wider than what one would expect if nobody had any true alpha, and sample results were just due to luck. Fama and French’s estimate (p. 1935) of the distribution of true alpha has a standard deviation of only 1.25% on an annual basis, meaning that only 16% of funds have true alphas (gross, before fees) of 1.25% or greater. And 16.5% have “true alphas” of negative 1.25% or worse. Similarly, study after study finds that past performance, especially long-term average returns, has essentially no power to predict future performance. What persistence there is seems related to the small one-year autocorrelation in underlying stock returns, which random portfolios will inherit. (Carhart (1997)).
For 40 years, academic finance has deplored active investing and paying fees for active management. It seems the average investor should save himself 67 basis points a year and just buy a passive index such as Vanguard’s total market portfolio, and the stock pickers should do something more productive like drive cabs. Active management and its fees seem like a total private, and social, waste.
b. A supply-demand view of active management and its fees
On second look, this hallowed view – and its antithesis -- reflect somewhat inconsistent positions.
Active management and active management fees have survived 40 years of efficient-markets disdain. If a freshwater economist doesn’t accept “folly” for “explaining” patterns of predictable price movement that survive 40 years, how can he accept it to explain such a stable industry equilibrium? From the other viewpoint, the saltwater consensus that markets are inefficient, and prices are far from “fundamentals” because of various behavioral or limits-to-arbitrage frictions, implies that there is a lot of alpha and there ought to be a lot more (and better) active management. You can’t both deplore the inefficiency of the market and active management that attempts to correct it.
“Explaining” active management and fees as folly is certainly inconsistent with my methodological outline: Folly is a name for a residual, not a quantitatively successful theory of active management.
We are not, however, at sea with an unfathomable puzzle. Jonathan Berk and Richard Green (2004) have created a supply-demand economic model that explains many of the basic facts of mutual fund performance, flows, and fees.
Suppose that some fund managers do have alpha. Alpha, however, has diminishing returns to scale. Traders report that many strategies apply only to smaller stocks[7] or suffer from price impact if they are implemented on too large a scale.
As an example, suppose that a manager can generate 10% alpha on $10 million dollars. Suppose also that his fees are a constant 1% of assets under management, and to make it simple assume the stock market value does not change. Thus, in his first year, the manager makes $1 million abnormal return. He pockets $100,000, (1%) and his investors get $900,000.
Seeing these good results, investors rush in. But the manager’s idea cannot scale past $10 million of assets, so the manager invests extra money in the index. With $20 million under management, he still generates $1 milllion alpha on the first $10 milllion, and nothing on the rest. He takes one percent of assets under management, now $200,000. But his investors still get $800,000 alpha. More investors pour in.
The process stops when the manager has $100 million under management. He still generates $1 million alpha, but now he collects $1 million in fees. His investors get exactly zero alpha, the competitive rate of return. But all are acting rationally[8].
This model explains many puzzling facts: In equilibrium, returns to investors are the same in active and passively managed funds. Funds earn only enough alpha to cover their fees. Good past fund returns do not forecast good future returns. Investors chase managers with good past returns anyway, one of the most-cited “irrational” puzzles about mutual funds.[9] Returns to investors do not measure alpha. Fees do. Managers with good track records get paid a lot.
This model doesn’t explain everything. It is predicated on the fee structure, and does not answer why the manager cannot simply charge $1 million fee to start with. (One might view the expansion of hedge funds as implementing exactly this fee innovation.) Fama and French (2010) complain that the average alpha after fees is negative, but their benchmarks contain no transactions costs.
Still, this analysis is worth celebrating as an interesting step in the “normal science,” “work harder” response of research to puzzles. After 40 years of unproductively deploring active management and its fees, it turns out a simple supply and demand story can explain many facts.
c. Is it silly to pay a proportional fee?
The fee structure of asset management is central to Greenwood and Scharfstein’s argument:
First, fee revenue is not a good measure of the “size” of finance. If you invest $10 million, agree to pay your hedge fund manager 2+20, and markets double, he pockets $2.2 million. If we followed the standard that we measure GDP in service industries by factor payments, we would call this $2.2 million of extra GDP, $2.2 million of “resources” devoted to “finance.” Greenwood and Scharfstein do not to make this mistake – they call it revenue. But why do we care about revenue? Revenue is not the same thing as social resources consumed. In this case, it’s a pure transfer. It’s better to think of the fee simply as a risk-sharing arrangement among co-investors. We didn’t know that stocks would double in value. At best some measure of the discounted present value of fees should count.
Second, if the market doubled in value because everything else did – capital stock, earnings, etc. – then surely by constant returns to scale, the value of investment management (whatever it is) would also double. Thus, if the argument is not just a repetition of the idea that fees should be zero, it must be that fees should not rise with higher valuations -- higher price/earnings ratios, lower discount rates -- in the same way fees should scale with rising cashflows. As well as not being an obvious proposition, such rises in valuation are temporary. Just wait a moment.
Third, we have seen in fact a substantial decline in fee rates in mutual funds. The constant fee rate simply did not happen.
Last, and most of all, just what do we expect fees to look like? If the current fee structure seems to produce a “too large” finance sector, what’s the optimal contract? What’s the distortion?
Greenwood and Scharfstein mention cost, a reasonable benchmark in a competitive market. Fees already scale with cost in the cross–section: mutual funds and hedge fund offer a schedule of lower fees for larger investments, which compensates the funds for the fixed costs of managing any account. So the complaint must be the time series: If you invest (say) $10,000, perhaps you should sign up for $100 per year fees regardless of performance? Why don’t we see this fee structure? One reason is regulation: mutual funds must treat all investors alike. They cannot charge a different fee rate to different vintages of investors. But the deeper reason is that contract is pretty obviously silly. Since most people make monthly contributions, each contribution would have to have a different fee, a nightmare of accounting. Or do they think mutual funds should bill by the hour, passing on “cost” as lawyers do? It’s pretty clear why that doesn’t happen!
More deeply, percentage fees pervade professional services, and have done so basically forever. Real estate agents charge percentage fees, and do better when house prices are higher – this is Greenwood and Scharfstein’s second major source of the increasing (until 2007) size of finance. Architects charge percentage fees. Contingency fee lawyers take a percentage of winnings. Corrupt officials take percentage bribes. Salesmen get percentage commissions.
In sum, the argument “finance is too big” because fees based on a percentage of assets under management are a big distortion seems awfully strained. At least I’d like to see a specific claim what the alternative, realistic, and privately or socially optimal contract is!
And percentage fees are a standard optimal contract argument. For example, from footnote 6:
More importantly, in the end, then, the supposed irrationality of AUM fees comes down simply to the position that nobody should pay any fees at all for active management, because there is no alpha, not that something is fundamentally wrong with the AUM form of the fees. If Berk and Green are right, the whole argument falls apart.
d. Where’s the wedge? What is the optimal contract and why don’t we see it?
Let us follow the economists’ methodology instead. Rather than argue whether fees are too big or too small, too fixed or too variable, let us try to identify the distortion that drives the contract away from being optimal. Greenwood and Scharfstein:
Individual investors, many of whom actively manage their portfolios and whose decisions in doing so are the stuff many behavioral biases, may be doing a lot better with 1% active management fee than actively managing on their own. As a matter of fact, individual investors are moving from active funds to passive funds, and fees in each fund are declining. Many of their fee advisers are bundling more and more services, such as tax and estate planning, which easily justify fees. At least naiveté is declining over time.
Most of all, the naiveté argument is belied by the fact that large, completely unconstrained, and very sophisticated investors are moving to high-fee active management.
Despite the troubles of 2008 involving illiquid private equity and interest rate swaps[10], the Harvard endowment is in 2012 about 2/3 externally managed by fee investors[11], and is 30% invested in “private equity” and “absolute return” (hedge funds).[12] The University of Chicago endowment is similarly invested in private equity and “absolute return,”[13] and whatever qualms some of its curmudgeonly faculty express about alphas, fees, and active management are not shared by the endowment:[14]
I only pick on our endowments for fun, and to spark interest among a readership of academic economists. This general approach to portfolio management is pretty much standard at endowments, nonprofits, sovereign wealth funds, family offices, pension funds, and so forth – anywhere there is a big pot of money to invest: These investors pay a lot of attention to allocation among name-based buckets, as represented in the pie charts, “domestic equity,” “international equity,” “fixed income,” “absolute return,” “private equity,” etc. Then, funds in these buckets are each allocated to a group of fee-based active managers, to deliver “alpha” within their style.
This overall approach bears no resemblance to standard portfolio theory. Any allocation other than market weights is an active bet. Name buckets make no sense, betas and correlations do. (For example, international and domestic equity are very highly correlated.) And don’t even ask whether hedge fund manager A is shorting what B is buying, what happens to fees when you give a portfolio of managers 2+20 compensation, half of them win, while half lose, or even why we pay the growth manager to buy the same stock that the value manager just sold.
Anywhere else in economics, we would ask why people have evolved this widely-practiced set of rough and ready decision procedures. Standard portfolio theory is, in fact, devilishly hard to apply in real-world situations, if one is not going to simply hold the market index. But and vaguely-stated “agency problems” and “naviete” seem an unpersuasive as well as superficial explanation.
“Agency problems” means problems in the contract between those in charge – boards of directors and trustees, or the wealthy individual at the head of the family office – and the manager who in turn hires the other managers. But this too is a story. Greenwood and Scharfstein neither explain nor cite a set of essential frictions (e.g. information or moral hazard), and how, as a result, a principal who wants to put it all in the Vanguard total-market index is forced to hire a manager who follows the above “standard” portfolio process.
Increasing naïveté and worsening “agency problems” seem even more dubious “explanations” for the increasing share of sophisticated investor’s portfolios in active high-fee investing.
As for excessive compensation, in the first layer of fees (fees to the manager who pays fees to the other managers) Harvard endowment’s CIO Jane Mendillo was paid[16] $4.7 million, most of which was straight salary. The University of Chicago’s Mark Schmid gets only $1.8 million, though our measely $5.6 billion AUM relative to Harvard’s $27.6 billion may have something to do with it. If we’re paying this much, is it that much of a puzzle that pension funds do the same thing?
II. Where is the alpha, and the value of active trading
Fees are half the puzzle. The other half of the puzzle is, is there any alpha in the first place, and if so, why? Really, the argument over fees came down to the argument that there is no alpha, so nobody should pay any fees at all. If there is alpha, the Berk and Green analysis suggests we may be on our way to understanding fees. Much of the traditional disparagement of active management fees comes down to the view that markets do not permit anyone to earn abnormal expected returns, so active trading itself is a waste of time.
The average investor theorem is an important benchmark in evaluating this question: The average investor must hold the value-weighted market portfolio. Alpha, relative to the market portfolio, is by definition a zero-sum game. For every investor who overweights a security or invests in a fund that does so, and earns alpha, some other investor must underweight the same security, and earn the same negative alpha. We can’t even collectively rebalance: If the stock market goes up, so that stocks represent 80% of wealth and bonds 20%, rather than previous 60% - 40% weights, we cannot all sell stocks to reestablish 60/40 weights. For each investor who rebalances, some other investor must overweight stocks even more. Finally, each of us can protect ourselves from being the negative-alpha mark with a simple strategy: hold the market portfolio, and refuse to trade away from it, no matter what price is offered.
a. Alpha. Lots of alpha.
Alpha seems a dicey proposition. But the last 20 years of finance research is as clear as empirical research in economics can be: There is alpha, at least relative to the market portfolio, lots of it, and all over the place. (Cochrane (2011) is one summary of this huge literature; I won’t cite each fact separately.)
A slew of “anomaly” strategies generate average returns but do not have large market betas, and so represent “alpha” relative to the market portfolio. Examples include small stocks, value stocks (low market value relative to book value; high “q”), momentum stocks (those that have risen in the previous year), stocks of companies that repurchase shares, stocks with high accruals, and stocks with low betas. The carry trade in maturities, currencies and credit (buy high yield securities, sell low yield securities), and writing options, especially the “disaster insurance” of out of the money put options, also generates alpha. Expected market returns are not constant, but vary over time by as much as their roughly 6% mean and more. The yields to the anomaly strategies also vary over time, further suggesting dynamic trading strategies as well as allocations to assets different from market weights.
The “financial constraints,” “financial frictions,” “institutional finance” “price pressure” and “limits to arbitrage” literatures go a step further. Especially when leveraged intermediaries are stressed, prices of nearly identical securities can become large. For example, during the financial crisis, corporate bonds traded at higher prices than their synthetic versions consisting of a treasury bond and a credit default swap. Covered interest parity failed – you could earn a larger return by buying euros, investing in European money markets, and converting back to dollars in the futures markets than by investing in US money markets. More generally, these literatures find evidence for “fire sales,” when stressed intermediaries try to dump large portfolios of assets on the market.
Most of these strategies also correspond to broad categories of common movement among securities. For example, if one buys a portfolio of “value” (low price) stocks in the hope of reaping the “value” alpha without risk, one soon discovers the tendency of all value stocks to rise and fall together, leaving risk in this portfolio. Unlike the conventional concept of an “inefficiency” alpha which diversifies away across multiple investments, the “value” alpha requires one to take on additional dimensions of undiversifiable risk.
In this way, these strategies represent additional (beyond the market) dimensions of “systematic” risk. For example, Fama and French (2006) summarize the expected returns to value stocks by their varying exposures to a “value factor,” leaving no alpha in a multifactor model. But the value factor represents alpha relative to the market portfolio.
Many of the time-varying risk premiums (expected returns) also rise and fall together. The financial crisis was a great time to buy any number of risky investments.
The broad brush of facts are not really under debate. Their interpretation is. First, they might indicate old-fashioned informational inefficiency – information, such as inside information, that somebody has, but is not fully reflected in market prices, for technical or behavioral reasons. The common movement of returns makes this argument harder to swallow, however.
Second, they might reflect imperfect risk sharing and (often temporary) market segmentation: information is fully incorporated in market prices, but, especially at high frequency, some risks are narrowly held, so command higher risk premiums then they would if all of us were able to participate fully. If the usual arbitrageurs are not around or able to bid aggressively, prices may fall further than they would otherwise, or if all of us were participating directly.
Third, they might reflect the multidimensional and time-varying nature of risk premiums in a fully integrated and informationally-efficient market. The capital asset pricing model was built on evidently untrue assumptions, after all, that the world presents iid shocks, risk premiums are constant over time, and the average investor does not have a job, real estate, or other non-marketed capital.
b. Implications of alpha
For our purposes, we do not really have to take a stand on which of these explanations carries the most weight. For the facts alone, and any of the interpretations, have important implications for the size of finance in general and the size of active management in particular.
The first and especially the second explanation, which is the heart of the “credit constraints,” “limits to arbitrage” and “institutional finance” literatures, imply directly that finance is too small. If information is not being incorporated into market prices, to such an extent that simple strategies with big alphas can be published in the Journal of Finance, it follows directly that there are not enough arbitrageurs. If assets are falling in “fire sales,” there are not enough fire-sale buyers following the fire trucks around. If credit constraints are impeding the flow of capital, we need to invest social resources into loosening those constraints. (To be precise, these facts document potential benefits to a larger finance sector. There are also costs, and one has to see if the benefits outweigh the costs. But establishing some benefits to enlargement of finance is surprising enough.)
Many of these puzzles suggest needed investments in institutional development, not just an expansion of existing structures. As a concrete and recent example, consider the “betting against beta” anomaly recently reexamined by Frazzini and Pedersen (2011a,b). Frazzini and Pedersen document that low beta stocks get higher average returns than they should, and high beta stocks get lower returns than they should. Their interpretation is that many investors want more risk than the market portfolio provides (half should, by the average investor theorem), yet leverage is costly to obtain. These investors buy high-beta stocks instead, driving up the prices of these stocks. “Let them buy options, and leveraged ETFs” you might say, but Frazzini and Petersen show the same patterns in these vehicles.
This is a narrowly-held risk explanation. Arbitrageurs cannot help: Correcting market prices through better risk sharing needs a mass of investors to change their portfolios and bear more risk. To bring prices back to what they should be, we need low-cost vehicles to bring high-beta investments to the half of the investing public who wants them.
We have seen this before. Small stocks were the first big anomaly relative to the CAPM, generating (it appeared) higher average returns than their betas justified. But it was very hard for individual investors to hold a diversified portfolio of small stocks. Arbitrageurs could only do so much, because small stocks move together, so a concentrated portfolio bears undiversifiable risk. Small stock funds were started, which allowed a mass of investors to participate. Those funds fees and expenses now contributed to revenue and measured GDP, in the way that the activities of individual investors holding small stocks did not. But they allowed the risk of small stocks to be widely shared, and the small stock premium to decline.
c. Multidimensional risk-sharing: A different view of markets and active management
The presence of dozens of “systematic” sources of risk, beyond the market, with substantial and time-varying premiums, has deep implications for asset management, no matter what the ultimate general-equilibrium source of these phenomena, in particular even if they result from time-varying macroeconomic risk and not frictions or inefficiencies. After all, if tomatoes are expensive today, you should put fewer of them in your salad. It doesn’t matter whether the sale comes from a “rational” bad harvest, or an “irrational” bubble in the tomato futures market. Likewise, it behooves an investor to see what risks are on sale today, no matter what their source, or have his manager do so.
The conventional disdain of management is rooted in the conventional view of the investment environment, which predated these discoveries. This view describes one source of “systematic” risk, accessible through passive investments: the market portfolio of risky assets. The investor understands this opportunity, and knows how much market risk he wishes to take. Returns are independent over time, so he does not often reconsider his “systematic” risk exposure. If he hires fee managers, their job is to earn “alpha.” In turn, alpha is interpreted only as return available from exploiting “inefficiency,” information the manager has that is not reflected in market prices, diversifiable across individual bets, and winnings from zero-sum gambling with other active managers. In this conventional view, the investor does not need to hedge the risks of job, business, outside income, or peculiar liability stream he is trying to fund.
But we have learned that this view of the world is completely wrong. Standard mean-variance (alpha-beta) portfolio advice is upended by the facts as they have emerged. Perhaps some of puzzling investment practice might be understood as a rough and ready way of adapting to the world as it is.
In a time-varying world, long-term investment is quite different from short-term investment. As a simple example, consider the riskless asset. A short-term investor holds a money-market fund as his riskless asset, and stays away from long-term bonds. To a long-term investor, by contrast, a long-term indexed bond is the “riskless” investment, exactly the opposite result, and money-market funds expose him to interest-rate risk. The long-term investor does not care about temporary price fluctuations of long-term bonds, as he knows the bond’s value is always the same at his horizon. Now to integrate this fact into the conventional short-horizon perspective, we say that the long-term investor values long-term bonds – despite their terrible one-year mean-variance properties, as a “state-variable hedging” asset.
Most investors also have jobs, businesses, or other non-marketeable income streams or fixed liabilities. Such investors should buy assets hedge those streams, and to hedge state variables for those streams. You want a portfolio that rises when there is bad news about your future income, before the bad future incomes arrive. University endowments supporting tenured professors have a risky asset stream, a bond-like liability stream leveraged by tax-arbitrage borrowing, and an important tournament relative to other universities in their objective functions (Goetzmann and Oster 2012). Pension funds have, well, pensions.
In turn, this time-varying desire to hedge outside income and state variable risk are prime candidates for economic explanations of the fact that equilibrium asset returns do not obey the static CAPM. If so, all this dynamic trading represents dynamic, socially beneficial insurance.
Now, none of this is easy. Merton (1971) described hedging demands 40 years ago, but even with thousands of following papers, academic portfolio theory really does not offer real-world advice. (See Cochrane 2012 for a long exposition.)
Even to a one-period mean-variance investor, taking advantage of time-varying multidimensional risks (being the insurance-writer) takes technical knowledge. Do you know how to write a CDS contract, get a stock momentum strategy to work without drowning in transactions costs, take advantage of temporarily high put option premiums in the Eurozone, or even reliably buy a “value” portfolio?
The nature and amount of multidimensional systematic risk one should take is much more nebulous and difficult to assess than the traditional question, how much market risk one should take. Have you even thought about whether you should be writing put options? Or maybe you should be buying them, as you buy home insurance, despite the premium?
Well, if it’s not easy, portfolio problems like this might certainly benefit from professional and specialized management, and such management ought to be able to charge a fee.
Hedge funds seem designed to serve this investment world. They can move to and from asset classes as risk premiums change, and by using leverage and derivatives they can alter overall exposures quickly without incurring the huge transactions cost of buying and selling large portfolios. (Why a portfolio of hedge funds makes sense is less clear.)
But in this dynamic buying and selling of multiple dimensions of risk, I do not need to invoke informational “inefficiency” at all, or violate the average investor theorem. Warren Buffett might write a lot of put options (he is), responding to a higher premium, because Chicago is buying them (it is), presumably responding to a risk analysis of the effect of another crash on its operations.
This radically different view of the investment environment, and portfolio formation in that environment certainly explodes the traditional view that disparages active management. I do not claim that current portfolio practice, and especially hiring many different high-fee hedge funds, is necessarily an optimal response. But it isn’t necessarily as “naïve” or “agency conflicted” as it otherwise seems, given we really have no concrete better advice to offer.
d. Marketing
In the quest to explain the persistence of active management and its fees, a second analogy seems worth pursuing: marketing.
Marketing and advertising have long been a puzzle to economists, Consumer Reports readers and coupon-clippers everywhere. Why buy the brand name when the generic is just as good – often nearly identical – and costs a lot less?
Theorem one of the frictionless theory of finance (the Modigilani-Miller theorem) says that the value of marketing is zero. The value of a portfolio is the value of its ingredients. Yet the money-management industry is essentially a marketing industry: They take the most generic and easily available ingredients you can think of, put them in a package, wrap a nice label on it, and market like crazy. Yes, from this point of view, it’s puzzling that people don’t buy the generic (Vanguard). It’s puzzling that they don’t buy the pieces and assemble their own (etrade). It’s puzzling that they pay quite so much for the slight differences in ingredients that the active managers or closed-end funds deliver. As it is puzzling that they pay for Coke, Clorox, Bayer, or bottled water; that they shop at Macys not Target, Whole Foods not Costco, and a hundred other brand names.
It’s not the time to digress into the “rationality” of the entire field of marketing and advertising. But dismissing centuries worth of branding and advertising as simply “naïveté” and folly seems, well, naïve. And perhaps by thinking of mutual fund management as an instance of this larger pattern, we may make some progress to understanding how it actually works.
III. The value of information trading
Much trading, and active management, however, is clearly aimed at bringing information to the market, not just better sharing time-varying multiple dimensions of risk or overcoming segmentation. Let us reconsider the social value of that activity.
Aren’t all resources devoted to a zero-sum game ipso-facto socially wasted? Aren’t half of the people who don’t index, by definition, deluded? Do we have to rely, as we must in defending the casino industry, on an entertainment value for trading?
No. The social point of information trading is “price discovery.” If someone has a piece of information, he buys on that information and his “price impact” makes prices reflect that information.
Thus, as French (2008) recognizes, there is a plausible argument here too that not enough social resources are devoted to price discovery, since it is a public good:
The literature on short-selling is revealing to this point. Actively-trading short sellers uncover far more financial fraud than the SEC, whose performance in the Bernie Madoff case is more typical than you might think. Some of the biggest and most uncontroversial alphas and “inefficiencies” – prices that do not incorporate available information – occur when there is an impediment, technical or regulatory, to the activities of these short sellers. Lamont (2004) finds 2.4% monthly alpha to a portfolio of short-selling constrained stocks, probably the clearest and largest clear informational “inefficiency” around except for inside information. This is a concrete example of inadequate (because constrained) trading.
Greenwood and Scharfstein also explain this point well:
But,
Having an efficient secondary-market price if established firms want to issue additional equity and invest is useful, however. Unlike Greenwood and Scharfstein, I see in the strong correlations between stock prices and investment, over time (through the tech boom and bust of the 1990s and through the financial crisis), and across industries (Google vs., say, GM), a validation of the Q theory of investment (Cochrane (1991), (2011) Figure 10), so long as you don’t difference the data too much. To dismiss the value of efficient markets because a few alternative regressions find that variables other than Q help to predict investment – and in the absence of a compelling theory why investment should be disconnected from asset markets, for the large, unconstrained, firms who regularly access those markets and account for the bulk of investment – seems again to take a puzzle as fact a bit too quickly.
But the whole cacophony of trading still seems like a lot of effort for this small goal. And, as Greenwood and Scharfstein point out, it’s hard to see why we need high frequency trading
Here, I think Greenwood and Scharfstein miss a second main function of asset markets: risk sharing. Efficient markets have social value, even in an endowment economy. For example, if I own tree A, and you own tree B, we want to sell each other shares of the trees in order to share risk. An inefficient market will impede this process. You can increase utility without changing production, by changing the allocation of production.
More generally, the attractiveness of stocks to fundamental investors – the ones who did fund the initial public offering – depends on the stocks’ liquidity, the confidence that these investors can quickly sell those stocks at the “right” price when they feel like exiting. The whole rationale for most securities market regulation – even regulation that makes markets less efficient, such as the ban on insider trading -- is precisely this idea that the retail investor should face a “fair” and liquid market is based on this idea.
And we all see the advantage of less volatile markets. Yet it is exactly the activities of traders, such as in Greenwood and Scharfstein’s example, which minimize volatility. Any predictable price movement – any violation of the random walk – adds volatility.
The view that trading is socially beneficial only if it directly finances “real” investment, if taken seriously, would imply dramatic changes in asset markets. Most derivatives are clearly zero-sum, zero-net supply bets. The dangerous idea that credit default swap trading should be banned except by holders of the underlying security would follow. Political prediction markets, recently endorsed by perhaps the most distinguished set of coauthors ever to write an economics article (Arrow et. al (2008)), ought to be banned (as the CFTC just did).
Interestingly, markets dreamed up by economists to benefit risk sharing – such as Robert Shiller’s GDP futures markets, or hurricane catastrophe options – do poorly. Liquidity for risk-sharing investors seems to depend on the presence of high-frequency information traders.
Yet Greenwood and Scharfstein’s example is telling. To make it more vivid, suppose that the fund got the earnings announcement 5 minutes before release. “Price impact” is nebulous, but in the efficient-market extreme that it can buy all it wants, the firm could appropriate the entire increase in company value – and more, in options markets – based on the information. In turn, it would be willing to expend real resources covering almost all that value in order to get the information. Which clearly is a social waste – having the price rise (if it does!) 5 minutes earlier is not worth expending the entire change in value of the firm.
I conclude that information trading of this sort sits at the conflict of two externalities / public goods. On the one hand, as French points out, “price impact” means that traders are not able to appropriate the full value of the information they bring, so there can be too few resources devoted to information production (and digestion, which strikes me as far more important). On the other hand, as Greenwood and Scharfstein point out, information is a non-rival good, and its exploitation in financial markets is a tournament (first to use it gets all the benefit) so the theorem that profits you make equal the social benefit of its production is false. It is indeed a waste of resources to bring information to the market a few minutes early, when that information will be revealed for free a few minutes later. Whether we have “too much” trading, too many resources devoted to finding information that somebody already has in will be revealed in a few minutes, or “too little” trading, markets where prices go for long times not reflecting important information, as many argued during the financial crisis, seems like a topic which neither theory nor empirical work has answered with any sort of clarity.
b. The puzzle of information trading
The process by which trading brings information to markets is still a bit of a mystery -- or, better, an active area of research on which we might be finally making fundamental progress. And we should understand that process before pronouncing on the value of the resources it consumes, and even more so before advocating regulations such as transactions taxes to reduce trading volume (or, just as likely, transactions subsidies to increase it!)
The classic theory of finance predicts that information is perfectly reflected in prices, with no trading volume. Every uninformed investor holds exactly the market index. He only buys and sells the entire index, when he wants to save or consume. In part, this is his defense against being the negative-alpha half of the average-investor theorem. Anyone offering to trade individual stocks must know something.
And if the “uninformed” investors would only behave this way, then informed investors could make no money from their information. French’s public good analysis is perfect.
Suppose Apple is trading at $500 per share, but you know that the iphone 6 is going to be a great product and make Apple worth $1000 per share. If you approach the index investor with an offer to buy Apple at $600 per share, he answers “no, I only buy and sell the entire index at one time.” If you offer $700, he answers “I don’t think you heard me. I only buy and sell the entire index.” You can keep trying, bidding the price up all the way to an offer of $1000 per share, at which point you give up. The price rises, reflecting your information, but no trade occurred. (This is a colloquial version of Milgrom and Stokey’s (1982) “No Trade Theorem.”)
Prices reflect information with zero trading volume and zero profits for informed investors. Once again, the classic theory of finance is dramatically at odds with the facts. Yet the facts are so durable that “folly” seems hardly persuasive, and in any case a poor predictor of the fascinating patterns we see in empirical work on volume and trading patterns.
The classic theory also ignores costs. If information traders cannot earn positive alpha, and, if producing information and trading on it takes any time and resources, the information traders won’t bother, and nobody is left to make prices reflect information in the first place. So, as Grossman and Stiglitz (1980) wrote, informationally efficient markets are impossible. Markets must be just inefficient enough to provide rewards for price discovery. But how? How do we overturn the no-trade theorem? Why are any of us “passive” investors are willing to take the other side of the “active” investors and suffer negative alphas?
Models of information trading posit “liquidity traders,” who take positions in individual securities for unspecified reasons. But who are they, really? Other models (Scheinkman and Xiong (2003) for example) posit slightly-irrational dogmatic beliefs, to unwind the recursion by which if you make an offer to me, I update my view of the asset’s value and refuse to trade. Then we can have markets with traders, each of which does believe he’s smarter than average. Many trading models, such as Acharya and Pedersen (2005) simply write down overlapping generations of agents without bequests who die every two days or so, to force them to trade. All these assumptions are obviously convenient shortcuts for getting trading into the model for other purposes, such as studying liquidity, but they are not really fundamental descriptions of the trading and price-discovery process.
Yet the fact staring us in the face is that “price-discovery,” the process by which information becomes embedded in market prices, in our world, uses a lot of trading volume, and a lot of time, effort and resources (GDP).
The empirical literature offers many tantalizing glimpses. There is often a period after a news announcement, of high price volatility and trading volume, in which markets seem to be fleshing out what the news announcement actually means for the value of the security. For example, Lucca and Moench (2012) Figure 6 show an enormous spike in stock-index trading volume and price volatility in the hours just after the Federal Reserve announcements of scheduled Open Market Committee interest-rate decisions. The information is perfectly public. But the process of the market digesting its meaning, aggregating the opinions of its traders, and deciding what value of the stock index should be with the new information, seems to need not just bidding, but actual shares to trade hands. (Banerjee and Kremer (2010) and Kim and Verrecchia (1991) offer models in which “disagreement” about public information leads to trading volume.) Perhaps the whole model of information, we all agree on the deck of cards, just not knowing which one was picked, is wrong.
Securities such as “on the run” or benchmark bonds, where “price discovery” takes place have higher prices than otherwise identical securities. Traders are willing to suffer lower average returns in order to participate in the information-trading game, in much the same way as money holders suffer lower returns for the transactions services money provides. (Cochrane (2003).)
The markets we see are set up, and exist, almost entirely to be markets for information trading. They are not markets for securities. We could easily handle individual’s lifetime saving and dissaving needs, and firms’ need to issue and retire equity, in much sleepier institutions such as a bank. Exchanges exist to facilitate price discovery, and that discovery comes with a vast amount of trading. Options were invented largely to facilitate information trading – highly leveraged positions without defaults. And they have existed this way, for hundreds of years. Though we may not yet understand how it works, is the existence of the NYSE and its volume of trading ipso-facto testament to human folly and naïveté? How do folly and naïveté begin to explain the interesting empirical patterns?
Yes, we could each avoid being the negative alpha trader subsidizing this whole bit by indexing. It’s a bit of a puzzle that we don’t. It’s a good thing we don’t, or there would be no traders making prices efficient. And, before we deplore, it’s worth remembering just how crazy passive indexing sounds to any market participant. “What,” they might respond, “would you walk in to a wine store and say `I can’t tell good from bad, and the arbitrageurs are out in force. Just give me one of everything?’”
c. High-frequency trading and market-making
As we think about the vast bulk of trading, and high-frequency trading in particular, however, I think that Greenwood and Scharfstein’s insightful example, and the vast literature it represents, is fundamentally misleading.
The amount of trading that is actually based on a well-understood, “fundamental,” piece of information about a company’s cashflow is minuscule. Models in which an informed trader posesses a “signal” about the value of a liquidating dividend just don’t describe the vast majority of trading. High frequency traders do not make money by trading on earnings reports 20 milliseconds ahead of the market.
High frequency traders – and even most “low frequency” day and week traders -- look at patterns of prices, volumes, and past trading activity, not signals about firm fundamentals. Their “information” consists of something else. If you ask them, they say they are acting as “market makers,” “liquidity providers,” making money off the bid-ask spread offered to uninformed “liquidity traders,” and trying hard to stay out of the way of the few traders that do have real “fundamental” information. If you ask their critics, they are artfully front-running demand from less sophisticated investors, removing “liquidity” and worsening “price impact,” i.e. removing the economic rewards to genuine information trading, worsening French’s “public good” problem and simply stealing from informed and liquidity traders.
However we come to understand these issues, the social costs and benefits of high frequency trading are clearly not at all related to the minor (as a fraction of GDP) resources devoted to them – the cost of useless fiber-optic cable, co-located servers, and the time of smart programmers who could be developing better iphone games. The social question for high-frequency trading is whether it screws up markets, or whether it provides needed “market-making” services.
There really isn’t much evidence (or solid theory) as yet. Isolated events lead me to some suspicion of “liquidity provision.” In the widely reported May 6 2010 “flash crash,” the S&P 500 fell 6% in a few minutes after a large e-mini index sell order arrived, and promptly recovered in less than an hour. (See Kirilenko, Kyle, Samadi, and Tuzun (2011) Figure 1. ) On July 19, 2012 Coke, McDonalds, IBM and Apple saw price sawtooths: sharp rises exactly on each hour, reversed by the next hour. These were widely attributed to an algorithm placing big orders exactly on the hour – and other algorithms not picking up on the inefficient signal abundantly obvious to the human eye. (See Vigna and Lauricella (2012) for some excellent graphs.) www.nanex.net/FlashCrash/OngoingResearch.html is a whole website devoted to weird behavior in high-frequency markets. These are palpable inefficiencies, and suggest a market with very little “liquidity provision,” not the opposite. Weller (2012) shows that “fundamental” orders pass through chains of as many as 10 high frequency traders, and presents a model in which this chain is a way to “provide liquidity.”
A “government failure” may be partly to blame. The regulators (SEC, CFTC) require that prices must jump in discrete intervals – once 1/8 dollar, now 1 cent. They require that limit orders are fulfilled in time order: if order A arrives before order B, order A must get filled completely and B gets nothing. But regulators do not discretize time, as they discretize price. A need only get there a nanosecond before B to get the entire order. (Rather than placing orders quickly, the ability to cancel limit orders that are in the back of the line if execution starts to be “too fast” may be one of the advantages of very high speed.) These rules may have made sense in the era of human traders, and came unglued with electronic trading.
The incentive to spend too much money on speed in this game is obvious. As is a solution (if my hunch proves correct by more careful theory and empirical work): Suppose that an exchange operated on a discrete clock, as a computer does. It could run a once-per-second, or even once-per-minute, or once-per-hour matching process. Within the time interval, limit orders accumulate. They are not shown, so that responding to the order book does not become the new game. Then orders are matched once per second, with all orders received during the second treated equally. If there are more buy than sell at the crossing price, orders are filled proportionally.
Such an exchange would eliminate high frequency trading. Now there would be no need to act faster than a second. Would it work better, and not have other problems? Would exchanges choose such systems if they were allowed to? Is there a force (the powerful influence of high-speed traders) that would keep exchanges from adopting such systems voluntarily, so it would have to be imposed by regulation? The Taiwan stock exchange already matches limit orders once every 90 seconds. (Barber, Lee, Liu, and Odean (2009).) Is its performance atrociously worse? These are all good questions.
IV. Housing, consumer credit, and the size of regulated finance
The facts revolving around the size of housing finance seem much easier to digest. The big increase came in fees associated with residential loan origination and refinancing.
Once again, much of this increase seems easily digested as the response to an increase in demand. The increase in demand – the housing boom – may indeed not have been “socially optimal.” (!) Here, Greenwood and Scharfstein echo many other critics of government policy for stoking the housing boom: “…the U.S. tax code – mainly through the mortgage interest deduction – already biases households towards investments in housing over other types of investments. Making mortgage credit cheaper and more available may have just exacerbated this bias.” Add low interest rates, the community reinvestment act, Fannie and Freddie, and the whole sordid cast of characters.
Still, should we fault an industry for reacting to an increase in demand? How much excess social size of finance here is fundamentally a “government failure?”
The large fees collected for refinancing mortgages (rather than originating and securitizing them) are a bit more puzzling. US mortgages are strangely complicated, and quite different from mortgages around the world. We feature fixed-rate mortgages with no prepayment penalty, and a complex refinancing option that requires reassessment of the property, fees, points, and therefore consumers to solve a complex option-exercise problem. We could surely do things more simply. But not to digress too much, collecting fees when interest rates decline or consumers exercise the option to lower housing equity is not GDP, (except to the extent that the fees represent time required to fill out endless forms), it’s simply collecting on the complex terms of an option contract.
Now, that’s not the whole story, as there was a lot of financial innovation surrounding mortgage finance, some of which notoriously exploded. “We raise concerns about the… fragility of the shadow banking system that facilitated this expansion.” Me too. And once again, fragility is the issue, not share of GDP.
A concrete example may help. A mortgage-backed security is a pool of mortgages. Suppose that such securities were bundled together into mutual funds, held at floating value or exchange-traded, just like equities, in your and my retirement accounts and our endowments’ investments. This structure would be a terrific financial innovation. Though mortgage-backed securities are a bit opaque, they are nowhere near as opaque as the entire balance sheet of, say, Citigroup. So, the monitoring and information functions we ask investors to play are much easier for a pool of mortgages than for Citigroup equity. Furthermore, such a structure would be immune to runs, bankruptices, needs for bailouts and so forth, just as equities are. The fees required to fill out the mortgage-backed security paperwork vs. the costs of bank paperwork are a tiny issue.
Now, this is not what fell apart in the financial crisis. Mortgage-backed securities and their “tranches” were held, not by floating-NAV mutual funds, but in “special purpose vehicles,” funded by rolling over very short-term debt. This structure looks like a traditional bank, whose assets are mortgages and whose liabilities are short-term debt, bank deposits. With a big exception: where is the equity, which is supposed to bear losses in the event the assets don’t work out so well?
The answer is, that the special purpose vehicles also had an off-balance-sheet guarantee from sponsoring banks. So the banks really were holding credit risk after all. But regulations did not place capital requirements on off-balance-sheet guarantees. So one function of the whole “shadow bank” was to create an actual “bank,” but evade capital requirements.
Whether or not we spent a bit more or less of GDP filling out forms and paying fees for these structures is clearly the least of its problems. The shadow bank was prone to a textbook systemic run, which is what happened.
Now, what category of problem is this? Is it an externality, public good, asymmetric information or other “market failure?” No, this seems like a clear case of “government failure,” unintended consequences of poorly structured regulation. A question for another day is whether multiplying by a factor of 10 the size of the regulatory structure – at considerable cost in resources – will prevent or exacerbate this problem. At least we know where the problem lies.
V. Runs, “shadow banking,” and the size of transactions finance.
The mention of “shadow banking” brings up a long literature on the “size of finance” that has not been mentioned yet. The issues go by the words “welfare costs of inflation,” or “optimum quantity of money,” but the central issue is the same.
As captured in the Baumol-Tobin model, we economize on money holdings by making lots of trips to the bank. But those trips are a waste of social resources. If money paid interest, or if the nominal interest rate were zero, we could avoid them all, along with the bank employees and ATM machines that service those trips. Robert Lucas (2000) put the point well:
Lucas (2000) approaches the question, not by adding up estimates of the services used to avoid holding money as we have, but by calculating the area under the M1 demand curve. He concludes that “the gain from reducing the annual inflation rate from 10 percent to zero is equivalent to an increase in real income of slightly less than one percent.” “Finance” under a 10 percent inflation rate is “too big” by 1% of GDP, from this clear distortion.
Lucas did not go further to estimate the benefits of reducing the nominal interest rate to zero, as when he wrote there was not much data from this regime. Depending on the rate of increase of money demand as interest rates go to zero, the area under the demand curve can be enormous. The fact that banks have increased excess reserves from about $6 billion to about $2 trillion as interest rates have fallen essentially to zero suggests that large welfare costs may have been the case.
In this context, part of the function of the “shadow banking system,” special-purpose vehicles, auction-rate securities, overnight repurchase agreements, or money market funds with risky assets (Reserve fund’s large Lehman holdings), like that of the old-fashioned banking system which created deposits, was that its liabilities were, to investors, cash-alternative assets – fixed value, first-come-first-serve accounts, paying some interest greater than zero. Rather than focus on its assets, mortages or mortgage-backed securities, perhaps we should focus on the optimal size, social benefits and costs of these liabilities.
Shadow-banking securities allow investors to avoid the needless interest costs of holding money, which is socially useful. But there is a better way to achieve the same outcome: a zero nominal rate, or money that pays interest. Relative to that benchmark, the costs of setting up the shadow banking system, for the purpose of providing interest-paying money, are wasted. More importantly, shadow-banking assets are prone to runs, which is an order of magnitude larger social cost.
In any case, following the 2007-2008 financial crisis, and perhaps more importantly the collapse of short-term interest rates to zero and the innovation that bank reserves pay interest, this form of “shadow banking” has essentially ceased to exist. RIP.
To drive home this point (and to complain about any analysis of the size of finance that stops in 2007), here are two graphs representing the size of the “shadow banking system,” culled from other papers. From Adrian and Ashcraft (2012, p. 24), the size of the securitized debt market (whose demise I regret – the problem is not securitizing debt but funding that asset with run-prone short-term liabilities)

And from Gorton and Metrick (2012), a different slice of securitized debt markets:

Furthermore, we could easily insure that the unstable parts of “shadow banking” do not come back. We can live the Friedman optimal quantity of money. The Fed can continue to pay market rates on reserves, even as interest rates rise. The Treasury can expand its plan to issue floating-rate debt, to issue floating-rate, fixed-value debt. This debt works like a money market fund: it has a constant redemption value of 1.00, interest is set on a floating basis, perhaps monthly.
Our economy can be costlessly satiated in liquidity. No resources at all need to be directed to economizing on the use of liquid assets, no resources at all need to be directed to the creation of private substitutes for interest-paying government money. The remaining interest cost of money applies only to actual cash, most of which is held overseas or illegally anyway. (US currency outstanding is about $1 trillion, which divided by 300 million is $3,300 per person, and 75% of which is $100 bills. What’s in your wallet?) And no resources need to be devoted to trying to stop, regulate, or clean up after, the runs which shadow-banking assets are prone to.
There will still be an incentive to try to issue “money-like” securities at slightly higher yield, by investing in riskier securities. Such securities would still be fragile and run-prone, which is a clear market failure. Once the economy is satiated in liquidity, the need to provide liquid assets need no longer restrain regulators from insisting that any intermediary must offer investments at floating value, and thus immune to runs. Banks do not even need to be allowed to issue deposits to fund mortgages, and can be required to issue arbitrary amounts of equity or long-term debt instead. The run-prone nature of the financial system – surely its largest cost – can easily be solved.
The emerging actual future, under Dodd-Frank, is a very highly regulated banking and shadow banking system, with a great deal of regulatory protection for incumbents. After all, too big to fail is too big to compete. The Fed is planning to reduce the interest rate on reserves, and the Treasury is not planning to issue fixed-value debt, so the shadow-banking system is likely to reemerge. This structure seems unlikely to produce much of an increase in efficiency – decline in fees and costs-- necessary to transfer an investor’s savings to a borrower’s investment. Whether it solves the “fragility” issue, especially in the era of looming sovereign debt crises, is a matter for another day.
VI. Concluding remarks
Greenwood and Scharfstein’s big picture is illuminating. The size of finance increased, at least through 2007, because fee income for refinancing, issuing, and securitizing mortgages rose; and because people moved assets to professional management; asset values increased, leading to greater fee income to those businesses. Compensation to employees in short supply – managers – increased, though compensation to others – janitors, secretaries – did not. Fee schedules themselves declined a bit.
To an economist, these facts scream “demand shifted out.” Some of the reasons for that demand shift are clearly government policy to promote the housing boom. Some of it is “government failure,” financial engineering to avoid ill-conceived regulations. Some of it – the part related to high valuation multiplied by percentage fees – is temporary. Another part – the part related to the creation of private money-substitutes – was a social waste, has declined in the zero-interest rate era, and does not need to come back. The latter can give us a less fragile financial system, which is arguably an order of magnitude larger social problem than its size.
The persistence of very active management, and very high fees, paid by sophisticated institutional investors, such as nonprofit endowments, sovereign wealth funds, high-wealth individuals, family offices, and many pension funds, remains a puzzle. To some extent, as I have outlined, this pattern may reflect the dynamic and multidimensional character of asset-market risk and risk premiums. To some extent, this puzzle also goes hand in hand with the puzzle why price discovery seems to require so much active trading. It is possible that there are far too few resources devoted to price discovery and market stabilization, i.e. pools of cash held out to pounce when there are fire sales. It is possible that there are too few resources devoted to matching the risk-bearing capacities of sophisticated investors with important outside income or liability streams to the multidimensional time-varying bazaar of risks offered in today’s financial markets.
Surveying our understanding of these issues, it is clearly far too early to make pronouncements such as “There is likely too much high-cost, active asset management,” or “society would be better off if the cost of this management could be reduced,“ with the not-so-subtle implication ( “Could be?” By whom I wonder?) that resources devoted to greater regulation (by no less naïve people with much larger agency problems and institutional constraints) will improve matters.
VII. References
Acharya, Viral V. and Lasse H. Pedersen, 2005 “Asset pricing with liquidity risk” Journal of Financial Economics, 77, 375-410.
Adrian, Tobias, and Adam B. Ashcraft, 2012, “Shadow Banking Regulation,” Federal Reserve Bank of New York Staff Report 559.
Alvarez, Fernando and Franceso Lippi, 2009, “Financial Innovation and the Transactions Demand for Cash,” Econometrica 77, 363–402. doi: 10.3982/ECTA7451
Ang, Andrew, 2010, “Liquidating Harvard,” Columbia CaseWorks ID#100312, http://www2.gsb.columbia.edu/faculty/aang/cases/Liquidating%20Harvard%20p1.pdf
Asness, Clifford, 2004, “An Alternative Future Part II: An Exploration of the Role of Hedge Funds.” Journal of Portfolio Management 31, 8-23.
Arrow, Kenneth J.,Robert Forsythe, Michael Gorham,Robert Hahn, Robin Hanson, John O. Ledyard, Saul Levmore, Robert Litan, Paul Milgrom, Forrest D. Nelson, George R. Neumann, Marco Ottaviani, Thomas C. Schelling, Robert J. Shiller, Vernon L. Smith, Erik Snowberg, Cass R. Sunstein, Paul C. Tetlock, Philip E. Tetlock, Hal R. Varian, Justin Wolfers, Eric Zitzewitz 2008, “The Promise of Prediction Markets,” Science 320 877-878 http://hanson.gmu.edu/promisepredmkt.pdf
Barber, Brad M., Yi-Tsung Lee Yu-Jane Liu, and Terrance Odean, 2008, “Just How Much Do Individual Investors Lose by Trading?” The Review of Financial Studies 22, 609-632.
Banerjee, Snehal and Ilan Kremer, 2010, “Disagreement and Learning: Dynamic Patterns of Trade,” The Journal of Finance 65, 1269–1302. doi: 10.1111/j.1540-6261.2010.01570.x
Berk, Jonathan B. and Richard C. Green, 2004, “Mutual Fund Flows and Information in Rational Markets,” Journal of Political Economic, 112, 1269-1295.
Berk, Jonathan B., 2005. “Five Myths of Active Portfolio Management," Journal of Portfolio Management, 31, 27-31.
Berk, Jonathan and Richard Stanton, 2007, “Managerial Ability, Compensation, and the closed-end fund discount” Journal of Finance 62, 529-556.
Carhart, Mark M., 1997, “On Persistence in Mutual Fund Performance,” Journal of Finance 52, 57-82.
Chevalier, Judith, and Glenn Ellison , “Risk Taking by Mutual Funds as a Response to Incentives,” Journal of Political Economy, 105, 1167-1200.
Cochrane, John H., 2003, “Stock as Money: Convenience Yield and the Tech-Stock Bubble” in William C. Hunter, George G. Kaufman and Michael Pomerleano, Eds., Asset Price Bubbles Cambridge: MIT Press 2003
Cochrane, John H., 2011, “Discount rates,” Journal of Finance 66, 1047-1108.
Cochrane, John H., 2012, “A mean-variance benchmark for intertemporal portfolio theory,” Manuscript, University of Chicago.
Cutler, David M., and Dan P. Ly, 2011, “The (Paper)Work of Medicine: Understanding International Medical Costs” Journal of Economic Perspectives 25, 3–25, page 8, http://pubs.aeaweb.org/doi/pdfplus/10.1257/jep.25.2.3
French, Kenneth R., 2008, “Presidential Address: The Cost of Active investing” The Journal of Finance 63(4) 1537-1573.
Fama, Eugene F., and Kenneth R. French 2006, “Dissecting Anomalies” Journal of Finance 63 (4) 1653-1678.
Fama, Eugene F. and Kenneth R. French, 2010, “Luck versus Skill in the Cross-Section of Mutual Fund Returns” Journal of Finance 65, 1915-1947.
Frazzini, Andrea, and Lasse Heje Pedersen, 2011a, “Betting against beta,” Manuscript, available at http://www.econ.yale.edu/~af227
Frazzini, Andrea and Lasse Heje Pedersen, 2011b, “Embedded Leverage,” Manuscript, available at http://www.econ.yale.edu/~af227
Friedman, Milton, 1969, The Optimum Quantity of Money and Other Essays. Chicago: Aldine.
Greenwood, Robin, and David S. Scharfstein, 2012, "The Growth of Modern Finance," Manuscript, Harvard University, http://www.people.hbs.edu/dscharfstein/Growth_of_Modern_Finance.pdf
Goetzmann, William N. and Sharon Oster, 2012, “Competition Among University Endowments,” NBER working paper 18173, http://papers.nber.org/papers/W18173
Gorton, Gary, and Andrew Metrick, 2012, Journal of Economic Literature 50, 128–150.
http:www.aeaweb.org/articles.php?doi=10.1257/jel.50:1.128
Grossman, Sanford G., and Joseph E. Stiglitz, 1980, “On the Impossibility of Informationally Efficient Markets” American Economic Review 70, 393-408
Kim, Oliver, and Robert E. Verrecchia, 1991, “Trading Volume and Price Reactions to Public Announcements,” Journal of Accounting Research 29, 302-321.
Kyle, Albert S., 1985, “Continuous Auctions and Insider Trading,” Econometrica 53, 1315-1336.
Kirilenko, Andrei, Albert S. Kyle, Mehrdad Samadi, Tagkan Tuzun, 2011, " The Flash Crash: The Impact of High Frequency Trading on an Electronic Market" Manuscript
Lamont, Owen, 2004, “Go Down Fighting: Short Sellers vs. Firms” Manuscript, Yale University
Lucas, Robert E., Jr., 2000, “Inflation and Welfare,” Econometrica, 68, 247–274.
Lucca, David O., and Emanuel Moench 2012, “The Pre-FOMC Announcement Drift,” Manuscript, Federal Reserve Bank of New York.
Milgrom, Paul, and Nancy Stokey, 1982, "Information, trade and common knowledge," Journal of Economic Theory 26, 17-27.
Paul Vigna and Tom Lauricella (2012) “Sawtooth Trading Hits Coke, IBM, McDonald’s, and Apple Shares” Wall Street Journal July 19, 2012, http://blogs.wsj.com/marketbeat/2012/07/19/sawtooth-trading-hits-coke-ibm-mcdonalds-and-apple-shares/
Philippon, Thomas 2008 “The Evolution of the US Financial Industry from 1860 to 2007: Theory and Evidence,” Manuscript, New York University
Pastor, Lubos, and Robert F. Stambaugh, 2012, “On the Size of the Active Management Industry,” Journal of Political Economy 120, 740-781
Scheinkman, Jose, and Wei Xiong, 2003, "Overconfidence and Speculative Bubbles," Journal of Political Economy, 1183-1219.
Weller, Brian, 2012, "Liquidity and High Frequency Trading," Manuscript, University of Chicago Booth School of Business.
Footnotes
[1]Affiliations: University of Chicago Booth School of Business, NBER, Hoover institution and Cato Institute. John.cochrane@chicagobooth.edu; http://faculty.chicagobooth.edu/john.cochrane/. (back)
[2] This is a response essay prepared for the Journal of Economic Perspectives, following Greewnood and Sharfstein (2012) “The growth of modern finance.” (back)
[3] Sources: BEA, GDP by industry and Census, 2007 Economic Census. For advertising, http://www.wpp.com/wpp/press/press/default.htm (back)
[4]Cutler and Ly (2011) p. 8, also http://thirdcoastfestival.org/library/1223-the-battle-over-billing-codes (back)
[5] The trend continues. On January 3 2012, the Wall Street Journal reported that in 2012 investors pulled $119 billion out of actively-managed funds, capping 5 years of $50-$140 billion annual withdrawals; and put $154 billion into stock and bond exchange-traded funds. “Investors sour on pro stock pickers,” http://online.wsj.com/article/SB10001424127887323689604578217944033194874.html (back)
[6] “Alpha” is the risk-adjusted expected return. It is most conventionally defined by a regression of a fund’s return, in excess of the risk free rate, on a constant and a set of index excess returns or “benchmarks.” The constant is then “alpha,” and is conventionally interpreted as extra average return accruing to the manager’s talent or superior information. The slope coefficient or “beta” represents the tendency of the fund return to move with the market portfolio; this component of risk and return can be synthesized essentially for free. The simplest calculation just uses a market-wide index on the right hand side of this regression. When portfolio strategies deviate from simple stock picking, more detailed “benchmark” indices are used to compare a manager’s performance to that available from simple passive strategies. (back)
[7] See Fama and French (2006) for example. (back)
[8] Berk and Green’s papers are much more sophisticated than this simple example, adding the uncertainty in fund returns, and a signal extraction problem, which gives rise to interesting information extraction problems and dynamics. A large literature has followed. Berk and Stanton (2007) consider the closed-end fund discount. Pastor and Stambaugh (2012) consider the industry size directly, and posit industry decreasing returns to scale in alpha production along with investor learning. Berk (2005) offers a simple exposition. (back)
[9] Chevalier and Ellison (1997). (back)
[10] See Ang (2010). (back)
[11] http://www.hmc.harvard.edu/investment-management/hybrid_model.html (back)
[12] http://www.hmc.harvard.edu/investment-management/policy_portfolio.html (back)
[13] http://investments.uchicago.edu/assetclasses.html (back)
[14] http://annualreport.uchicago.edu/page/endowment (back)
[15] http://investments.uchicago.edu/committee.html (back)
[16] Chart: Top paid CIOs of tax-exempt institutions Pensions & Investments, November 7 2011, http://www.pionline.com/article/20111107/CHART04/111109905 (back)
This came about as a "response essay" to Robin Greenwood and David Scharfstein's "The growth of modern finance" for the Journal of Economic Perspectives. That's why Robin and David are the target of a lot of criticism. But they're really just standing in for a lot of opinion that finance is "too big," in part because they did such a good and evenhanded job of synthesizing that point of view. So, sorry for picking on you, Robin and David!
I'm sure the JEP will make me cut it down and tone it down, so this is the fun first draft.
Is Finance Too Big?
John H. Cochrane [1],[2]
January 7 2013
I. Introduction
The US spends $150 billion a year on advertising and marketing[3]. $150 billion, just to trick people into buying stuff they don’t need. What a waste.
There are 2.2 people doing medical billing for every doctor that actually sees patients, costing $360 billion[4] -- 2.4% of GDP. Talk about “too big!”
Wholesale, retail trade and transportation cost 14.6% of GDP, while all manufacturing is only 11.5% of GDP. We spend more to move stuff around than to make it!
A while ago, my wife asked me to look at light fixtures. Have you seen how many thousands of different kinds of light fixtures there are? The excess complexity is insane. Ten ought to be plenty.
It’s ridiculous how much people overpay for brand names when they can get the generic a lot cheaper. They must be pretty naive.
Business school finance professors are horribly overpaid. Ask an anthropologist! We must really have snowballed university administrations to get paid nearly half a million bucks, and work a grand total of 10 weeks a year, all to teach students that there is no alpha to be made in the stock market.
Did you know that Kim Kardashian gets $600,000 just to show up at a nightclub in Vegas? How silly is that?
It’s a lot of fun to pass judgment on “social benefits,” “size,” “complexity” of industry, and “excessive compensation” of people who get paid more than we do, isn’t it? But it isn’t really that productive either.
As economists we have a structure for thinking about these questions.
We start with the first welfare theorem: loosely, supply, demand and competition lead to socially beneficial arrangements. Yet the world around often doesn’t obviously conform to simple supply and demand arguments. See above. Then, we embark on a three-pronged investigation: First, maybe there is something about the situation we don’t understand. Durable institutions and arrangements, despite competition and lack of government interference, sometimes take us years to understand. Second, maybe there is a “market failure,” an externality, public good, natural monopoly, asymmetric information, or missing market, that explains our puzzle. Third, we often discover a “government failure,” that the puzzling aspect of our world is an unintended consequence of law or regulation. The regulators got captured, the market innovated around a regulation, or legal restrictions stop supply and demand from working.
Once we understand a puzzle, we are in a position to begin to diagnose a divergence between reality and socially desirable outcomes, and we can start to think of how to improve the outcome. But, though “some” may the world puzzling, or “many” might “voice concerns,” we don’t pronounce until we understand how one of these mechanisms describes the situation. Quantitatively: Cocktail-party externalities need not apply.
“I don’t understand it” doesn’t mean “it’s bad.” And since that attitude pervades regulation in general and financial regulation in particular, we do the world a disservice if we echo it.
I belabor this point, because I do not offer a competing black box. I don’t claim to estimate the socially-optimal “size of finance” at 8.267% of GDP, so there. Though apparently rhetorically effective, this is simply not how we do economics. After all, if a bunch of academics could sit around our offices and decide which industries were “too big,” which ones were “too small,” and close our papers with “policy recommendations” to remedy the matter, central planning would have worked. A little Hayekian modesty suggests we focus on documenting the distortions, not pronouncing on optimal industry sizes. Documenting distortions has also been, historically, far more productive than pronouncing on the optimal size of industries, optimal compensation of executives, “global imbalances,” “savings gluts,” “excessive consumption,” or other outcomes.
Furthermore, when we think about the social costs and benefits of finance, at this point in our history, it seems a bit strange to be arguing whether 5% or 8% of GDP is the right “size” of finance. Looking back, I think that we would all happily accept 3% extra GDP in return for a financial system that is not prone to runs and crises. We are accepting a big increase in resources devoted to financial regulation and compliance, and a potentially larger reduction in the efficiency, innovation, and competitiveness of financial institutions and markets, in an attempt (misguided or not) to avoid runs and crises. And the run-prone nature of our financial system, together with consequently massive regulation and government guarantees, look like more fertile fishing ground for market and government failures than does mere size. Looking forward, insulating the financial system from sovereign default seems like a much more pressing issue than thinking of regulations to increase or reduce its “size.”
Still, the size of finance represents a contentious issue, so let us think about it.
The financial services industry has grown a lot, reaching 8% of GDP. Greenwood and Scharfstein (2012) usefully focus the discussion by identifying the two areas of most significant revenue growth: asset management and fees associated with the expansion and refinancing of household debt.
The asset management story is straightforward:
“Individuals and institutions shifted an increasing share of their assets to investment management firms – first to mutual funds and institutional asset management firms (which mainly manage investments for pension funds and endowments), and then increasingly to hedge funds, private equity funds and venture capital funds, which charge much higher fees. We show that a large part of this [asset management revenue] growth is a simple consequence of rising asset values without commensurate declines in percentage fees.”Given how much high-fee asset management is in the news, and somewhat envious discussions around faculty lunchrooms and university development offices, it is indeed surprising to learn that the more mundane business of providing consumer credit and residential mortgages, and charging transaction fees, contributed a larger increase in finance-sector revenue, at least up until 2007. Proprietary trading profits don’t even make their list.
I won’t delve much into numbers, except to point out how hard measurement is. The difference between GDP, revenue, wages, employees, value added, etc. matters. We really want to know how many resources are devoted to the function of finance, but GDP is based on industry. If a steel company runs its pension fund investments in-house, that activity is counted as part of the steel industry GDP. If the steel company hires an asset management company to run its pension fund investments, now that same activity shows up as finance industry GDP. If an individual shifts his investments to a mutual fund, his investment management activity shifts from home production, not counted at all, to market activity. GDP shows a larger finance industry, though overall resources devoted to money management may decline. And data on the size of finance that ends in 2007 leads to an obvious retort – like the weather, if you don’t like it, just wait a bit.
Instead, let us take the broad brush of facts as Greenwood and Scharfstein have summarized them and think about how we should interpret those facts. (I pick on Greenwood and Scharfstein’s interpretations, but this isn’t really a comment on their paper. Their interpretations are a well-stated representative of a larger academic literature, especially Phillippon (2008), and a much larger public and policy debate. Greenwood and Scharfstein merely make a concise and specific reference point for a broader discussion.)
As Greenwood and Scharfstein note, there are many obviously beneficial aspects to the growth of finance over the last 40 years. My grandfather held individual shares of stock. I hold a share of the Vanguard total market index in a 401(k) plan, a much better diversified and much lower-cost form of investment. The much larger participation, diversification, and consequent risk-sharing, plausibly has led not only to better retirement savings opportunities, but to halving of the cost of capital for businesses that issue equity – price/earnings ratios seem to be on a permanently higher plateau, or at least so we hope. The accessibility of housing, student, and consumer finance has become if anything too easy. Let’s instead focus on the contentious issues.
Their basic facts seem to scream: The demand for financial services shifted out. People with scarce skills supplying such services made a lot of money. (Portfolio managers, yes. Janitors and secretaries, no.) A system with proportional fees, a common structure in professional services, interacted with stock and home price increases (a different surge in demand) to produce increased revenue. That fee rates did not fall seems hardly surprising when faced with a surge in demand. Why demand shifted out, and why house and stock prices rose (temporarily, it turns out) are good questions. But they don’t have much to do with the structure of the finance industry.
Still, let us dig deeper. In particular, I wish to trace what the voluminous recent literature in finance implies for the “size” and “social benefits” question.
II. Active management and fees
a. The traditional view
High-fee active management and underlying active trading has been deplored by academic finance in the efficient-markets tradition for a generation. French (2008) is a comprehensive summary. French estimates that equity investors in aggregate, between 1980 and 2006, paid 0.67% per year in active management fees, which conservatively means 10% of the value of their investments.
French, and Greenwood and Scharfstein, note that the increase in management fee revenue lies on top of several offsetting trends. Individuals moved investments from direct holdings to mutual funds, and then to index or other passive and semi-passive funds[5]. Their participation overall increased, and new investors in defined-contribution plans invest almost exclusively in funds.
Mutual fund fee rates, came down sharply, in part reflecting the slow spread of very low-fee index and other passive funds, and in part simply reflecting competitive pressure. French reports that the average equity fund fee fell from 2.19% in 1980 to 1% in 2007. Greenwood and Scharfstein report that average bond fund fees fell from 2.04% to 0.75% Some index funds charge as little as 0.07% .
Total mutual fund fee revenues reflect these declining rates multiplied by a much larger share of assets under management. So, the behavior of individuals and funds oriented towards individuals does reflect sensible forces, if one is willing to grant a rather long time span for those forces to affect industry structure.
High-wealth individuals and institutions moved their investments to even more actively-managed hedge funds, private equity, venture capital, and other even higher-fee and more active investment vehicles. Hedge fund fee rates are reportedly stable over time with 1.5-2.5% management fee plus 15-25% “performance” fee; the fund managers keep 15-25% of the profits above a high-water mark. This part of the market surely offers the more puzzling behavior. Asness (2004) chalks fee stability up to supply and demand: more investors are looking for hedge funds (with great track records) than entrepreneurs are able to set up such funds.
That would all make some sense if investors were getting something for those fees. But the aggregate portfolio of equity mutual funds is almost exactly the value-weighted market portfolio, and the average alpha[6] before fees is very nearly zero. (Fama and French (2010) is an excellent tip of this iceberg of research.) The evidence from hedge funds, which struggles with much worse survivor-bias and multidimensional benchmarking issues, still ends up arguing over a few percentage points of alpha one way or the other, hardly the expected gold mine.
Mediocre average results might not be surprising. With free entry in any business, the average performer will be average. The average economics professor isn’t that good either. But one might expect that, as in every other field of human endeavor, the good managers would be reliably good. Every manager I’ve ever talked to responds “Sure, the average manager doesn’t know what he’s doing. But we have alpha.” Michael Jordan’s past performance was a reliable indication of what would happen in the next game.
In this context, Fama and French’s (2010) more surprising finding is that the distribution of alpha is remarkably small. The sample of mutual fund alpha is only very slightly wider than what one would expect if nobody had any true alpha, and sample results were just due to luck. Fama and French’s estimate (p. 1935) of the distribution of true alpha has a standard deviation of only 1.25% on an annual basis, meaning that only 16% of funds have true alphas (gross, before fees) of 1.25% or greater. And 16.5% have “true alphas” of negative 1.25% or worse. Similarly, study after study finds that past performance, especially long-term average returns, has essentially no power to predict future performance. What persistence there is seems related to the small one-year autocorrelation in underlying stock returns, which random portfolios will inherit. (Carhart (1997)).
For 40 years, academic finance has deplored active investing and paying fees for active management. It seems the average investor should save himself 67 basis points a year and just buy a passive index such as Vanguard’s total market portfolio, and the stock pickers should do something more productive like drive cabs. Active management and its fees seem like a total private, and social, waste.
b. A supply-demand view of active management and its fees
On second look, this hallowed view – and its antithesis -- reflect somewhat inconsistent positions.
Active management and active management fees have survived 40 years of efficient-markets disdain. If a freshwater economist doesn’t accept “folly” for “explaining” patterns of predictable price movement that survive 40 years, how can he accept it to explain such a stable industry equilibrium? From the other viewpoint, the saltwater consensus that markets are inefficient, and prices are far from “fundamentals” because of various behavioral or limits-to-arbitrage frictions, implies that there is a lot of alpha and there ought to be a lot more (and better) active management. You can’t both deplore the inefficiency of the market and active management that attempts to correct it.
“Explaining” active management and fees as folly is certainly inconsistent with my methodological outline: Folly is a name for a residual, not a quantitatively successful theory of active management.
We are not, however, at sea with an unfathomable puzzle. Jonathan Berk and Richard Green (2004) have created a supply-demand economic model that explains many of the basic facts of mutual fund performance, flows, and fees.
Suppose that some fund managers do have alpha. Alpha, however, has diminishing returns to scale. Traders report that many strategies apply only to smaller stocks[7] or suffer from price impact if they are implemented on too large a scale.
As an example, suppose that a manager can generate 10% alpha on $10 million dollars. Suppose also that his fees are a constant 1% of assets under management, and to make it simple assume the stock market value does not change. Thus, in his first year, the manager makes $1 million abnormal return. He pockets $100,000, (1%) and his investors get $900,000.
Seeing these good results, investors rush in. But the manager’s idea cannot scale past $10 million of assets, so the manager invests extra money in the index. With $20 million under management, he still generates $1 milllion alpha on the first $10 milllion, and nothing on the rest. He takes one percent of assets under management, now $200,000. But his investors still get $800,000 alpha. More investors pour in.
The process stops when the manager has $100 million under management. He still generates $1 million alpha, but now he collects $1 million in fees. His investors get exactly zero alpha, the competitive rate of return. But all are acting rationally[8].
This model explains many puzzling facts: In equilibrium, returns to investors are the same in active and passively managed funds. Funds earn only enough alpha to cover their fees. Good past fund returns do not forecast good future returns. Investors chase managers with good past returns anyway, one of the most-cited “irrational” puzzles about mutual funds.[9] Returns to investors do not measure alpha. Fees do. Managers with good track records get paid a lot.
This model doesn’t explain everything. It is predicated on the fee structure, and does not answer why the manager cannot simply charge $1 million fee to start with. (One might view the expansion of hedge funds as implementing exactly this fee innovation.) Fama and French (2010) complain that the average alpha after fees is negative, but their benchmarks contain no transactions costs.
Still, this analysis is worth celebrating as an interesting step in the “normal science,” “work harder” response of research to puzzles. After 40 years of unproductively deploring active management and its fees, it turns out a simple supply and demand story can explain many facts.
c. Is it silly to pay a proportional fee?
The fee structure of asset management is central to Greenwood and Scharfstein’s argument:
If the stock market doubles in value through price appreciation, there is no obvious reason why investment management services in the aggregate would be worth more, or would cost more to provide.I’m tempted to say, “There you go again.” “No obvious reason” means “I don’t know” not “I know it’s too big.” But let’s deeper into this ubiquitous fee arrangement.
First, fee revenue is not a good measure of the “size” of finance. If you invest $10 million, agree to pay your hedge fund manager 2+20, and markets double, he pockets $2.2 million. If we followed the standard that we measure GDP in service industries by factor payments, we would call this $2.2 million of extra GDP, $2.2 million of “resources” devoted to “finance.” Greenwood and Scharfstein do not to make this mistake – they call it revenue. But why do we care about revenue? Revenue is not the same thing as social resources consumed. In this case, it’s a pure transfer. It’s better to think of the fee simply as a risk-sharing arrangement among co-investors. We didn’t know that stocks would double in value. At best some measure of the discounted present value of fees should count.
Second, if the market doubled in value because everything else did – capital stock, earnings, etc. – then surely by constant returns to scale, the value of investment management (whatever it is) would also double. Thus, if the argument is not just a repetition of the idea that fees should be zero, it must be that fees should not rise with higher valuations -- higher price/earnings ratios, lower discount rates -- in the same way fees should scale with rising cashflows. As well as not being an obvious proposition, such rises in valuation are temporary. Just wait a moment.
Third, we have seen in fact a substantial decline in fee rates in mutual funds. The constant fee rate simply did not happen.
Last, and most of all, just what do we expect fees to look like? If the current fee structure seems to produce a “too large” finance sector, what’s the optimal contract? What’s the distortion?
Greenwood and Scharfstein mention cost, a reasonable benchmark in a competitive market. Fees already scale with cost in the cross–section: mutual funds and hedge fund offer a schedule of lower fees for larger investments, which compensates the funds for the fixed costs of managing any account. So the complaint must be the time series: If you invest (say) $10,000, perhaps you should sign up for $100 per year fees regardless of performance? Why don’t we see this fee structure? One reason is regulation: mutual funds must treat all investors alike. They cannot charge a different fee rate to different vintages of investors. But the deeper reason is that contract is pretty obviously silly. Since most people make monthly contributions, each contribution would have to have a different fee, a nightmare of accounting. Or do they think mutual funds should bill by the hour, passing on “cost” as lawyers do? It’s pretty clear why that doesn’t happen!
More deeply, percentage fees pervade professional services, and have done so basically forever. Real estate agents charge percentage fees, and do better when house prices are higher – this is Greenwood and Scharfstein’s second major source of the increasing (until 2007) size of finance. Architects charge percentage fees. Contingency fee lawyers take a percentage of winnings. Corrupt officials take percentage bribes. Salesmen get percentage commissions.
In sum, the argument “finance is too big” because fees based on a percentage of assets under management are a big distortion seems awfully strained. At least I’d like to see a specific claim what the alternative, realistic, and privately or socially optimal contract is!
And percentage fees are a standard optimal contract argument. For example, from footnote 6:
Fixed percentage fees can be justified if one [investor and manager] believes that a manager has the ability to create alpha…. But this argument does not hold in the aggregate, since alpha is zero sum across investors.This argument is logically wrong. Alpha sums to zero over all investors. The managers may be the positive alpha investors, and individual investors the negative alpha investors. Current empirical evidence suggests they are not for mutual funds, but it’s not impossible.
More importantly, in the end, then, the supposed irrationality of AUM fees comes down simply to the position that nobody should pay any fees at all for active management, because there is no alpha, not that something is fundamentally wrong with the AUM form of the fees. If Berk and Green are right, the whole argument falls apart.
d. Where’s the wedge? What is the optimal contract and why don’t we see it?
Let us follow the economists’ methodology instead. Rather than argue whether fees are too big or too small, too fixed or too variable, let us try to identify the distortion that drives the contract away from being optimal. Greenwood and Scharfstein:
…there are significant distortions in the market for professional asset management arising from investor naiveté (mainly households) and agency problems associated with certain institutional investors (mainly pension funds). These distortions have led to increased use of active asset management and may also have biased active asset managers away from socially efficient forms of information acquisition and asset allocation.
… investor naiveté results in more active management and more expensive active management than in a world with sophisticated investors.
…Pension fund and endowment managers are presumably less naïve than households, but institutional factors and agency problems may lead them to overpay for active management40 years of “naiveté” -- a new term in behavioral finance, as far as I can tell – strikes me as simply saying “we have no idea.”
Individual investors, many of whom actively manage their portfolios and whose decisions in doing so are the stuff many behavioral biases, may be doing a lot better with 1% active management fee than actively managing on their own. As a matter of fact, individual investors are moving from active funds to passive funds, and fees in each fund are declining. Many of their fee advisers are bundling more and more services, such as tax and estate planning, which easily justify fees. At least naiveté is declining over time.
Most of all, the naiveté argument is belied by the fact that large, completely unconstrained, and very sophisticated investors are moving to high-fee active management.
Despite the troubles of 2008 involving illiquid private equity and interest rate swaps[10], the Harvard endowment is in 2012 about 2/3 externally managed by fee investors[11], and is 30% invested in “private equity” and “absolute return” (hedge funds).[12] The University of Chicago endowment is similarly invested in private equity and “absolute return,”[13] and whatever qualms some of its curmudgeonly faculty express about alphas, fees, and active management are not shared by the endowment:[14]
“The majority of TRIP’s [“Total Return Investment Portfolio] assets are managed by external managers specializing in a specific asset class, geography, or strategy. These asset managers outperformed their respective benchmarks in every asset class, adding over 500 basis points of performance versus the strategic benchmark.”500 basis ponts of alpha. Put that in your pipe and smoke it, Fama and French. At least we know one active manager’s perception of what they get for their fees.
I only pick on our endowments for fun, and to spark interest among a readership of academic economists. This general approach to portfolio management is pretty much standard at endowments, nonprofits, sovereign wealth funds, family offices, pension funds, and so forth – anywhere there is a big pot of money to invest: These investors pay a lot of attention to allocation among name-based buckets, as represented in the pie charts, “domestic equity,” “international equity,” “fixed income,” “absolute return,” “private equity,” etc. Then, funds in these buckets are each allocated to a group of fee-based active managers, to deliver “alpha” within their style.
This overall approach bears no resemblance to standard portfolio theory. Any allocation other than market weights is an active bet. Name buckets make no sense, betas and correlations do. (For example, international and domestic equity are very highly correlated.) And don’t even ask whether hedge fund manager A is shorting what B is buying, what happens to fees when you give a portfolio of managers 2+20 compensation, half of them win, while half lose, or even why we pay the growth manager to buy the same stock that the value manager just sold.
Anywhere else in economics, we would ask why people have evolved this widely-practiced set of rough and ready decision procedures. Standard portfolio theory is, in fact, devilishly hard to apply in real-world situations, if one is not going to simply hold the market index. But and vaguely-stated “agency problems” and “naviete” seem an unpersuasive as well as superficial explanation.
“Agency problems” means problems in the contract between those in charge – boards of directors and trustees, or the wealthy individual at the head of the family office – and the manager who in turn hires the other managers. But this too is a story. Greenwood and Scharfstein neither explain nor cite a set of essential frictions (e.g. information or moral hazard), and how, as a result, a principal who wants to put it all in the Vanguard total-market index is forced to hire a manager who follows the above “standard” portfolio process.
Harvard's endowment was overseen by a high-powered board, including its president Larry Summers, probably the least naïve investor on the planet. The picture that Summers and his board, or the high-powered talent on Chicago's investment committee[15] are simply too naïve to demand passive investing, or that they really want the endowments to sit on the Vanguard total market index, but some "agency problem" with the managers they hire and fire with alacrity prevents that outcome from happening, simply does not wash. Just ask them. (I have.) This is exactly the portfolio and process that the people in charge want! Perhaps the whole world is naïve, but then so are the designers and implementers of regulation when they, like Summers, go to Washington to correct matters.
Increasing naïveté and worsening “agency problems” seem even more dubious “explanations” for the increasing share of sophisticated investor’s portfolios in active high-fee investing.
As for excessive compensation, in the first layer of fees (fees to the manager who pays fees to the other managers) Harvard endowment’s CIO Jane Mendillo was paid[16] $4.7 million, most of which was straight salary. The University of Chicago’s Mark Schmid gets only $1.8 million, though our measely $5.6 billion AUM relative to Harvard’s $27.6 billion may have something to do with it. If we’re paying this much, is it that much of a puzzle that pension funds do the same thing?
II. Where is the alpha, and the value of active trading
Fees are half the puzzle. The other half of the puzzle is, is there any alpha in the first place, and if so, why? Really, the argument over fees came down to the argument that there is no alpha, so nobody should pay any fees at all. If there is alpha, the Berk and Green analysis suggests we may be on our way to understanding fees. Much of the traditional disparagement of active management fees comes down to the view that markets do not permit anyone to earn abnormal expected returns, so active trading itself is a waste of time.
The average investor theorem is an important benchmark in evaluating this question: The average investor must hold the value-weighted market portfolio. Alpha, relative to the market portfolio, is by definition a zero-sum game. For every investor who overweights a security or invests in a fund that does so, and earns alpha, some other investor must underweight the same security, and earn the same negative alpha. We can’t even collectively rebalance: If the stock market goes up, so that stocks represent 80% of wealth and bonds 20%, rather than previous 60% - 40% weights, we cannot all sell stocks to reestablish 60/40 weights. For each investor who rebalances, some other investor must overweight stocks even more. Finally, each of us can protect ourselves from being the negative-alpha mark with a simple strategy: hold the market portfolio, and refuse to trade away from it, no matter what price is offered.
a. Alpha. Lots of alpha.
Alpha seems a dicey proposition. But the last 20 years of finance research is as clear as empirical research in economics can be: There is alpha, at least relative to the market portfolio, lots of it, and all over the place. (Cochrane (2011) is one summary of this huge literature; I won’t cite each fact separately.)
A slew of “anomaly” strategies generate average returns but do not have large market betas, and so represent “alpha” relative to the market portfolio. Examples include small stocks, value stocks (low market value relative to book value; high “q”), momentum stocks (those that have risen in the previous year), stocks of companies that repurchase shares, stocks with high accruals, and stocks with low betas. The carry trade in maturities, currencies and credit (buy high yield securities, sell low yield securities), and writing options, especially the “disaster insurance” of out of the money put options, also generates alpha. Expected market returns are not constant, but vary over time by as much as their roughly 6% mean and more. The yields to the anomaly strategies also vary over time, further suggesting dynamic trading strategies as well as allocations to assets different from market weights.
The “financial constraints,” “financial frictions,” “institutional finance” “price pressure” and “limits to arbitrage” literatures go a step further. Especially when leveraged intermediaries are stressed, prices of nearly identical securities can become large. For example, during the financial crisis, corporate bonds traded at higher prices than their synthetic versions consisting of a treasury bond and a credit default swap. Covered interest parity failed – you could earn a larger return by buying euros, investing in European money markets, and converting back to dollars in the futures markets than by investing in US money markets. More generally, these literatures find evidence for “fire sales,” when stressed intermediaries try to dump large portfolios of assets on the market.
Most of these strategies also correspond to broad categories of common movement among securities. For example, if one buys a portfolio of “value” (low price) stocks in the hope of reaping the “value” alpha without risk, one soon discovers the tendency of all value stocks to rise and fall together, leaving risk in this portfolio. Unlike the conventional concept of an “inefficiency” alpha which diversifies away across multiple investments, the “value” alpha requires one to take on additional dimensions of undiversifiable risk.
In this way, these strategies represent additional (beyond the market) dimensions of “systematic” risk. For example, Fama and French (2006) summarize the expected returns to value stocks by their varying exposures to a “value factor,” leaving no alpha in a multifactor model. But the value factor represents alpha relative to the market portfolio.
Many of the time-varying risk premiums (expected returns) also rise and fall together. The financial crisis was a great time to buy any number of risky investments.
The broad brush of facts are not really under debate. Their interpretation is. First, they might indicate old-fashioned informational inefficiency – information, such as inside information, that somebody has, but is not fully reflected in market prices, for technical or behavioral reasons. The common movement of returns makes this argument harder to swallow, however.
Second, they might reflect imperfect risk sharing and (often temporary) market segmentation: information is fully incorporated in market prices, but, especially at high frequency, some risks are narrowly held, so command higher risk premiums then they would if all of us were able to participate fully. If the usual arbitrageurs are not around or able to bid aggressively, prices may fall further than they would otherwise, or if all of us were participating directly.
Third, they might reflect the multidimensional and time-varying nature of risk premiums in a fully integrated and informationally-efficient market. The capital asset pricing model was built on evidently untrue assumptions, after all, that the world presents iid shocks, risk premiums are constant over time, and the average investor does not have a job, real estate, or other non-marketed capital.
b. Implications of alpha
For our purposes, we do not really have to take a stand on which of these explanations carries the most weight. For the facts alone, and any of the interpretations, have important implications for the size of finance in general and the size of active management in particular.
The first and especially the second explanation, which is the heart of the “credit constraints,” “limits to arbitrage” and “institutional finance” literatures, imply directly that finance is too small. If information is not being incorporated into market prices, to such an extent that simple strategies with big alphas can be published in the Journal of Finance, it follows directly that there are not enough arbitrageurs. If assets are falling in “fire sales,” there are not enough fire-sale buyers following the fire trucks around. If credit constraints are impeding the flow of capital, we need to invest social resources into loosening those constraints. (To be precise, these facts document potential benefits to a larger finance sector. There are also costs, and one has to see if the benefits outweigh the costs. But establishing some benefits to enlargement of finance is surprising enough.)
Many of these puzzles suggest needed investments in institutional development, not just an expansion of existing structures. As a concrete and recent example, consider the “betting against beta” anomaly recently reexamined by Frazzini and Pedersen (2011a,b). Frazzini and Pedersen document that low beta stocks get higher average returns than they should, and high beta stocks get lower returns than they should. Their interpretation is that many investors want more risk than the market portfolio provides (half should, by the average investor theorem), yet leverage is costly to obtain. These investors buy high-beta stocks instead, driving up the prices of these stocks. “Let them buy options, and leveraged ETFs” you might say, but Frazzini and Petersen show the same patterns in these vehicles.
This is a narrowly-held risk explanation. Arbitrageurs cannot help: Correcting market prices through better risk sharing needs a mass of investors to change their portfolios and bear more risk. To bring prices back to what they should be, we need low-cost vehicles to bring high-beta investments to the half of the investing public who wants them.
We have seen this before. Small stocks were the first big anomaly relative to the CAPM, generating (it appeared) higher average returns than their betas justified. But it was very hard for individual investors to hold a diversified portfolio of small stocks. Arbitrageurs could only do so much, because small stocks move together, so a concentrated portfolio bears undiversifiable risk. Small stock funds were started, which allowed a mass of investors to participate. Those funds fees and expenses now contributed to revenue and measured GDP, in the way that the activities of individual investors holding small stocks did not. But they allowed the risk of small stocks to be widely shared, and the small stock premium to decline.
c. Multidimensional risk-sharing: A different view of markets and active management
The presence of dozens of “systematic” sources of risk, beyond the market, with substantial and time-varying premiums, has deep implications for asset management, no matter what the ultimate general-equilibrium source of these phenomena, in particular even if they result from time-varying macroeconomic risk and not frictions or inefficiencies. After all, if tomatoes are expensive today, you should put fewer of them in your salad. It doesn’t matter whether the sale comes from a “rational” bad harvest, or an “irrational” bubble in the tomato futures market. Likewise, it behooves an investor to see what risks are on sale today, no matter what their source, or have his manager do so.
The conventional disdain of management is rooted in the conventional view of the investment environment, which predated these discoveries. This view describes one source of “systematic” risk, accessible through passive investments: the market portfolio of risky assets. The investor understands this opportunity, and knows how much market risk he wishes to take. Returns are independent over time, so he does not often reconsider his “systematic” risk exposure. If he hires fee managers, their job is to earn “alpha.” In turn, alpha is interpreted only as return available from exploiting “inefficiency,” information the manager has that is not reflected in market prices, diversifiable across individual bets, and winnings from zero-sum gambling with other active managers. In this conventional view, the investor does not need to hedge the risks of job, business, outside income, or peculiar liability stream he is trying to fund.
But we have learned that this view of the world is completely wrong. Standard mean-variance (alpha-beta) portfolio advice is upended by the facts as they have emerged. Perhaps some of puzzling investment practice might be understood as a rough and ready way of adapting to the world as it is.
In a time-varying world, long-term investment is quite different from short-term investment. As a simple example, consider the riskless asset. A short-term investor holds a money-market fund as his riskless asset, and stays away from long-term bonds. To a long-term investor, by contrast, a long-term indexed bond is the “riskless” investment, exactly the opposite result, and money-market funds expose him to interest-rate risk. The long-term investor does not care about temporary price fluctuations of long-term bonds, as he knows the bond’s value is always the same at his horizon. Now to integrate this fact into the conventional short-horizon perspective, we say that the long-term investor values long-term bonds – despite their terrible one-year mean-variance properties, as a “state-variable hedging” asset.
Most investors also have jobs, businesses, or other non-marketeable income streams or fixed liabilities. Such investors should buy assets hedge those streams, and to hedge state variables for those streams. You want a portfolio that rises when there is bad news about your future income, before the bad future incomes arrive. University endowments supporting tenured professors have a risky asset stream, a bond-like liability stream leveraged by tax-arbitrage borrowing, and an important tournament relative to other universities in their objective functions (Goetzmann and Oster 2012). Pension funds have, well, pensions.
In turn, this time-varying desire to hedge outside income and state variable risk are prime candidates for economic explanations of the fact that equilibrium asset returns do not obey the static CAPM. If so, all this dynamic trading represents dynamic, socially beneficial insurance.
Now, none of this is easy. Merton (1971) described hedging demands 40 years ago, but even with thousands of following papers, academic portfolio theory really does not offer real-world advice. (See Cochrane 2012 for a long exposition.)
Even to a one-period mean-variance investor, taking advantage of time-varying multidimensional risks (being the insurance-writer) takes technical knowledge. Do you know how to write a CDS contract, get a stock momentum strategy to work without drowning in transactions costs, take advantage of temporarily high put option premiums in the Eurozone, or even reliably buy a “value” portfolio?
The nature and amount of multidimensional systematic risk one should take is much more nebulous and difficult to assess than the traditional question, how much market risk one should take. Have you even thought about whether you should be writing put options? Or maybe you should be buying them, as you buy home insurance, despite the premium?
Well, if it’s not easy, portfolio problems like this might certainly benefit from professional and specialized management, and such management ought to be able to charge a fee.
Hedge funds seem designed to serve this investment world. They can move to and from asset classes as risk premiums change, and by using leverage and derivatives they can alter overall exposures quickly without incurring the huge transactions cost of buying and selling large portfolios. (Why a portfolio of hedge funds makes sense is less clear.)
But in this dynamic buying and selling of multiple dimensions of risk, I do not need to invoke informational “inefficiency” at all, or violate the average investor theorem. Warren Buffett might write a lot of put options (he is), responding to a higher premium, because Chicago is buying them (it is), presumably responding to a risk analysis of the effect of another crash on its operations.
This radically different view of the investment environment, and portfolio formation in that environment certainly explodes the traditional view that disparages active management. I do not claim that current portfolio practice, and especially hiring many different high-fee hedge funds, is necessarily an optimal response. But it isn’t necessarily as “naïve” or “agency conflicted” as it otherwise seems, given we really have no concrete better advice to offer.
d. Marketing
In the quest to explain the persistence of active management and its fees, a second analogy seems worth pursuing: marketing.
Marketing and advertising have long been a puzzle to economists, Consumer Reports readers and coupon-clippers everywhere. Why buy the brand name when the generic is just as good – often nearly identical – and costs a lot less?
Theorem one of the frictionless theory of finance (the Modigilani-Miller theorem) says that the value of marketing is zero. The value of a portfolio is the value of its ingredients. Yet the money-management industry is essentially a marketing industry: They take the most generic and easily available ingredients you can think of, put them in a package, wrap a nice label on it, and market like crazy. Yes, from this point of view, it’s puzzling that people don’t buy the generic (Vanguard). It’s puzzling that they don’t buy the pieces and assemble their own (etrade). It’s puzzling that they pay quite so much for the slight differences in ingredients that the active managers or closed-end funds deliver. As it is puzzling that they pay for Coke, Clorox, Bayer, or bottled water; that they shop at Macys not Target, Whole Foods not Costco, and a hundred other brand names.
It’s not the time to digress into the “rationality” of the entire field of marketing and advertising. But dismissing centuries worth of branding and advertising as simply “naïveté” and folly seems, well, naïve. And perhaps by thinking of mutual fund management as an instance of this larger pattern, we may make some progress to understanding how it actually works.
III. The value of information trading
Much trading, and active management, however, is clearly aimed at bringing information to the market, not just better sharing time-varying multiple dimensions of risk or overcoming segmentation. Let us reconsider the social value of that activity.
Aren’t all resources devoted to a zero-sum game ipso-facto socially wasted? Aren’t half of the people who don’t index, by definition, deluded? Do we have to rely, as we must in defending the casino industry, on an entertainment value for trading?
No. The social point of information trading is “price discovery.” If someone has a piece of information, he buys on that information and his “price impact” makes prices reflect that information.
Thus, as French (2008) recognizes, there is a plausible argument here too that not enough social resources are devoted to price discovery, since it is a public good:
In aggregate, active investors almost certainly improve the accuracy of financial prices. This, in turn, improves society’s allocation of resources. Thus, my estimate of the cost of active investing also measures society’s cost of price discovery.
I offer no evidence on whether society is buying too little or too much of this good. Price discovery, however, is an externality—each active investor pays the full cost of his efforts but captures only a tiny slice of the benefit—so there is no reason to think active investors purchase the optimal amount of price discovery.The common complaint “the financial crisis proves markets aren’t efficient” is at heart, paradoxically, a complaint that there was not enough active information-based trading. “Efficiency” means that prices incorporate available information. All a more “efficient” stock market or mortgage-backed security market could have done is to fall sooner. (It’s a complaint, not a proof – one can argue that markets were efficient, failing only to be clairvoyant, as runs are by definition unpredictable. The word “efficiency” is often misused by people who do not understand its definition. I once told a newspaper reporter that I thought markets were pretty “efficient,” and he quoted me as saying markets are “self-regulating!”)
The literature on short-selling is revealing to this point. Actively-trading short sellers uncover far more financial fraud than the SEC, whose performance in the Bernie Madoff case is more typical than you might think. Some of the biggest and most uncontroversial alphas and “inefficiencies” – prices that do not incorporate available information – occur when there is an impediment, technical or regulatory, to the activities of these short sellers. Lamont (2004) finds 2.4% monthly alpha to a portfolio of short-selling constrained stocks, probably the clearest and largest clear informational “inefficiency” around except for inside information. This is a concrete example of inadequate (because constrained) trading.
Greenwood and Scharfstein also explain this point well:
From a social benefit perspective, however, the critical question is not whether active management leads to excess returns—it does not. [On average, in mutual funds.] Rather what matters is whether the pursuit of excess returns produces socially valuable information.So, the question is whether we want prices to be more efficient. Is this useful?
The social benefits from efficient markets are difficult to measure. One of the main benefits is that firms can raise new capital at prices that accurately reflect their fundamental value, i.e, that they can raise money in primary markets to fund real investments.Without speculators evaluating Google’s plans and driving the price to stratospheric levels, Google could not have issued stock to fund investments in, say, driverless cars. Certainly, this kind of investment would not be supported by bank lending.
But,
Of course, much information discovery is oriented toward trading securities in secondary markets, i.e., trading securities that already exist.This is a good point. IPOs, venture capital, and private equity are important functions of finance, but they do not depend on information trading in established markets.
Having an efficient secondary-market price if established firms want to issue additional equity and invest is useful, however. Unlike Greenwood and Scharfstein, I see in the strong correlations between stock prices and investment, over time (through the tech boom and bust of the 1990s and through the financial crisis), and across industries (Google vs., say, GM), a validation of the Q theory of investment (Cochrane (1991), (2011) Figure 10), so long as you don’t difference the data too much. To dismiss the value of efficient markets because a few alternative regressions find that variables other than Q help to predict investment – and in the absence of a compelling theory why investment should be disconnected from asset markets, for the large, unconstrained, firms who regularly access those markets and account for the bulk of investment – seems again to take a puzzle as fact a bit too quickly.
But the whole cacophony of trading still seems like a lot of effort for this small goal. And, as Greenwood and Scharfstein point out, it’s hard to see why we need high frequency trading
For example, a hedge fund may be willing to pay $20,000 to form a more accurate prediction of a company’s earnings to be released in the next week… in an exchange economy without production,… the $20,000 is a social loss because getting this information into prices one week earlier is unlikely to lead to a more efficient allocation of real resources.I.e., the firm is unlikely to issue equity during the week. This is an important example to think about.
Here, I think Greenwood and Scharfstein miss a second main function of asset markets: risk sharing. Efficient markets have social value, even in an endowment economy. For example, if I own tree A, and you own tree B, we want to sell each other shares of the trees in order to share risk. An inefficient market will impede this process. You can increase utility without changing production, by changing the allocation of production.
More generally, the attractiveness of stocks to fundamental investors – the ones who did fund the initial public offering – depends on the stocks’ liquidity, the confidence that these investors can quickly sell those stocks at the “right” price when they feel like exiting. The whole rationale for most securities market regulation – even regulation that makes markets less efficient, such as the ban on insider trading -- is precisely this idea that the retail investor should face a “fair” and liquid market is based on this idea.
And we all see the advantage of less volatile markets. Yet it is exactly the activities of traders, such as in Greenwood and Scharfstein’s example, which minimize volatility. Any predictable price movement – any violation of the random walk – adds volatility.
The view that trading is socially beneficial only if it directly finances “real” investment, if taken seriously, would imply dramatic changes in asset markets. Most derivatives are clearly zero-sum, zero-net supply bets. The dangerous idea that credit default swap trading should be banned except by holders of the underlying security would follow. Political prediction markets, recently endorsed by perhaps the most distinguished set of coauthors ever to write an economics article (Arrow et. al (2008)), ought to be banned (as the CFTC just did).
Interestingly, markets dreamed up by economists to benefit risk sharing – such as Robert Shiller’s GDP futures markets, or hurricane catastrophe options – do poorly. Liquidity for risk-sharing investors seems to depend on the presence of high-frequency information traders.
Yet Greenwood and Scharfstein’s example is telling. To make it more vivid, suppose that the fund got the earnings announcement 5 minutes before release. “Price impact” is nebulous, but in the efficient-market extreme that it can buy all it wants, the firm could appropriate the entire increase in company value – and more, in options markets – based on the information. In turn, it would be willing to expend real resources covering almost all that value in order to get the information. Which clearly is a social waste – having the price rise (if it does!) 5 minutes earlier is not worth expending the entire change in value of the firm.
I conclude that information trading of this sort sits at the conflict of two externalities / public goods. On the one hand, as French points out, “price impact” means that traders are not able to appropriate the full value of the information they bring, so there can be too few resources devoted to information production (and digestion, which strikes me as far more important). On the other hand, as Greenwood and Scharfstein point out, information is a non-rival good, and its exploitation in financial markets is a tournament (first to use it gets all the benefit) so the theorem that profits you make equal the social benefit of its production is false. It is indeed a waste of resources to bring information to the market a few minutes early, when that information will be revealed for free a few minutes later. Whether we have “too much” trading, too many resources devoted to finding information that somebody already has in will be revealed in a few minutes, or “too little” trading, markets where prices go for long times not reflecting important information, as many argued during the financial crisis, seems like a topic which neither theory nor empirical work has answered with any sort of clarity.
b. The puzzle of information trading
The process by which trading brings information to markets is still a bit of a mystery -- or, better, an active area of research on which we might be finally making fundamental progress. And we should understand that process before pronouncing on the value of the resources it consumes, and even more so before advocating regulations such as transactions taxes to reduce trading volume (or, just as likely, transactions subsidies to increase it!)
The classic theory of finance predicts that information is perfectly reflected in prices, with no trading volume. Every uninformed investor holds exactly the market index. He only buys and sells the entire index, when he wants to save or consume. In part, this is his defense against being the negative-alpha half of the average-investor theorem. Anyone offering to trade individual stocks must know something.
And if the “uninformed” investors would only behave this way, then informed investors could make no money from their information. French’s public good analysis is perfect.
Suppose Apple is trading at $500 per share, but you know that the iphone 6 is going to be a great product and make Apple worth $1000 per share. If you approach the index investor with an offer to buy Apple at $600 per share, he answers “no, I only buy and sell the entire index at one time.” If you offer $700, he answers “I don’t think you heard me. I only buy and sell the entire index.” You can keep trying, bidding the price up all the way to an offer of $1000 per share, at which point you give up. The price rises, reflecting your information, but no trade occurred. (This is a colloquial version of Milgrom and Stokey’s (1982) “No Trade Theorem.”)
Prices reflect information with zero trading volume and zero profits for informed investors. Once again, the classic theory of finance is dramatically at odds with the facts. Yet the facts are so durable that “folly” seems hardly persuasive, and in any case a poor predictor of the fascinating patterns we see in empirical work on volume and trading patterns.
The classic theory also ignores costs. If information traders cannot earn positive alpha, and, if producing information and trading on it takes any time and resources, the information traders won’t bother, and nobody is left to make prices reflect information in the first place. So, as Grossman and Stiglitz (1980) wrote, informationally efficient markets are impossible. Markets must be just inefficient enough to provide rewards for price discovery. But how? How do we overturn the no-trade theorem? Why are any of us “passive” investors are willing to take the other side of the “active” investors and suffer negative alphas?
Models of information trading posit “liquidity traders,” who take positions in individual securities for unspecified reasons. But who are they, really? Other models (Scheinkman and Xiong (2003) for example) posit slightly-irrational dogmatic beliefs, to unwind the recursion by which if you make an offer to me, I update my view of the asset’s value and refuse to trade. Then we can have markets with traders, each of which does believe he’s smarter than average. Many trading models, such as Acharya and Pedersen (2005) simply write down overlapping generations of agents without bequests who die every two days or so, to force them to trade. All these assumptions are obviously convenient shortcuts for getting trading into the model for other purposes, such as studying liquidity, but they are not really fundamental descriptions of the trading and price-discovery process.
Yet the fact staring us in the face is that “price-discovery,” the process by which information becomes embedded in market prices, in our world, uses a lot of trading volume, and a lot of time, effort and resources (GDP).
The empirical literature offers many tantalizing glimpses. There is often a period after a news announcement, of high price volatility and trading volume, in which markets seem to be fleshing out what the news announcement actually means for the value of the security. For example, Lucca and Moench (2012) Figure 6 show an enormous spike in stock-index trading volume and price volatility in the hours just after the Federal Reserve announcements of scheduled Open Market Committee interest-rate decisions. The information is perfectly public. But the process of the market digesting its meaning, aggregating the opinions of its traders, and deciding what value of the stock index should be with the new information, seems to need not just bidding, but actual shares to trade hands. (Banerjee and Kremer (2010) and Kim and Verrecchia (1991) offer models in which “disagreement” about public information leads to trading volume.) Perhaps the whole model of information, we all agree on the deck of cards, just not knowing which one was picked, is wrong.
Securities such as “on the run” or benchmark bonds, where “price discovery” takes place have higher prices than otherwise identical securities. Traders are willing to suffer lower average returns in order to participate in the information-trading game, in much the same way as money holders suffer lower returns for the transactions services money provides. (Cochrane (2003).)
The markets we see are set up, and exist, almost entirely to be markets for information trading. They are not markets for securities. We could easily handle individual’s lifetime saving and dissaving needs, and firms’ need to issue and retire equity, in much sleepier institutions such as a bank. Exchanges exist to facilitate price discovery, and that discovery comes with a vast amount of trading. Options were invented largely to facilitate information trading – highly leveraged positions without defaults. And they have existed this way, for hundreds of years. Though we may not yet understand how it works, is the existence of the NYSE and its volume of trading ipso-facto testament to human folly and naïveté? How do folly and naïveté begin to explain the interesting empirical patterns?
Yes, we could each avoid being the negative alpha trader subsidizing this whole bit by indexing. It’s a bit of a puzzle that we don’t. It’s a good thing we don’t, or there would be no traders making prices efficient. And, before we deplore, it’s worth remembering just how crazy passive indexing sounds to any market participant. “What,” they might respond, “would you walk in to a wine store and say `I can’t tell good from bad, and the arbitrageurs are out in force. Just give me one of everything?’”
c. High-frequency trading and market-making
As we think about the vast bulk of trading, and high-frequency trading in particular, however, I think that Greenwood and Scharfstein’s insightful example, and the vast literature it represents, is fundamentally misleading.
The amount of trading that is actually based on a well-understood, “fundamental,” piece of information about a company’s cashflow is minuscule. Models in which an informed trader posesses a “signal” about the value of a liquidating dividend just don’t describe the vast majority of trading. High frequency traders do not make money by trading on earnings reports 20 milliseconds ahead of the market.
High frequency traders – and even most “low frequency” day and week traders -- look at patterns of prices, volumes, and past trading activity, not signals about firm fundamentals. Their “information” consists of something else. If you ask them, they say they are acting as “market makers,” “liquidity providers,” making money off the bid-ask spread offered to uninformed “liquidity traders,” and trying hard to stay out of the way of the few traders that do have real “fundamental” information. If you ask their critics, they are artfully front-running demand from less sophisticated investors, removing “liquidity” and worsening “price impact,” i.e. removing the economic rewards to genuine information trading, worsening French’s “public good” problem and simply stealing from informed and liquidity traders.
However we come to understand these issues, the social costs and benefits of high frequency trading are clearly not at all related to the minor (as a fraction of GDP) resources devoted to them – the cost of useless fiber-optic cable, co-located servers, and the time of smart programmers who could be developing better iphone games. The social question for high-frequency trading is whether it screws up markets, or whether it provides needed “market-making” services.
There really isn’t much evidence (or solid theory) as yet. Isolated events lead me to some suspicion of “liquidity provision.” In the widely reported May 6 2010 “flash crash,” the S&P 500 fell 6% in a few minutes after a large e-mini index sell order arrived, and promptly recovered in less than an hour. (See Kirilenko, Kyle, Samadi, and Tuzun (2011) Figure 1. ) On July 19, 2012 Coke, McDonalds, IBM and Apple saw price sawtooths: sharp rises exactly on each hour, reversed by the next hour. These were widely attributed to an algorithm placing big orders exactly on the hour – and other algorithms not picking up on the inefficient signal abundantly obvious to the human eye. (See Vigna and Lauricella (2012) for some excellent graphs.) www.nanex.net/FlashCrash/OngoingResearch.html is a whole website devoted to weird behavior in high-frequency markets. These are palpable inefficiencies, and suggest a market with very little “liquidity provision,” not the opposite. Weller (2012) shows that “fundamental” orders pass through chains of as many as 10 high frequency traders, and presents a model in which this chain is a way to “provide liquidity.”
A “government failure” may be partly to blame. The regulators (SEC, CFTC) require that prices must jump in discrete intervals – once 1/8 dollar, now 1 cent. They require that limit orders are fulfilled in time order: if order A arrives before order B, order A must get filled completely and B gets nothing. But regulators do not discretize time, as they discretize price. A need only get there a nanosecond before B to get the entire order. (Rather than placing orders quickly, the ability to cancel limit orders that are in the back of the line if execution starts to be “too fast” may be one of the advantages of very high speed.) These rules may have made sense in the era of human traders, and came unglued with electronic trading.
The incentive to spend too much money on speed in this game is obvious. As is a solution (if my hunch proves correct by more careful theory and empirical work): Suppose that an exchange operated on a discrete clock, as a computer does. It could run a once-per-second, or even once-per-minute, or once-per-hour matching process. Within the time interval, limit orders accumulate. They are not shown, so that responding to the order book does not become the new game. Then orders are matched once per second, with all orders received during the second treated equally. If there are more buy than sell at the crossing price, orders are filled proportionally.
Such an exchange would eliminate high frequency trading. Now there would be no need to act faster than a second. Would it work better, and not have other problems? Would exchanges choose such systems if they were allowed to? Is there a force (the powerful influence of high-speed traders) that would keep exchanges from adopting such systems voluntarily, so it would have to be imposed by regulation? The Taiwan stock exchange already matches limit orders once every 90 seconds. (Barber, Lee, Liu, and Odean (2009).) Is its performance atrociously worse? These are all good questions.
IV. Housing, consumer credit, and the size of regulated finance
The facts revolving around the size of housing finance seem much easier to digest. The big increase came in fees associated with residential loan origination and refinancing.
Once again, much of this increase seems easily digested as the response to an increase in demand. The increase in demand – the housing boom – may indeed not have been “socially optimal.” (!) Here, Greenwood and Scharfstein echo many other critics of government policy for stoking the housing boom: “…the U.S. tax code – mainly through the mortgage interest deduction – already biases households towards investments in housing over other types of investments. Making mortgage credit cheaper and more available may have just exacerbated this bias.” Add low interest rates, the community reinvestment act, Fannie and Freddie, and the whole sordid cast of characters.
Still, should we fault an industry for reacting to an increase in demand? How much excess social size of finance here is fundamentally a “government failure?”
The large fees collected for refinancing mortgages (rather than originating and securitizing them) are a bit more puzzling. US mortgages are strangely complicated, and quite different from mortgages around the world. We feature fixed-rate mortgages with no prepayment penalty, and a complex refinancing option that requires reassessment of the property, fees, points, and therefore consumers to solve a complex option-exercise problem. We could surely do things more simply. But not to digress too much, collecting fees when interest rates decline or consumers exercise the option to lower housing equity is not GDP, (except to the extent that the fees represent time required to fill out endless forms), it’s simply collecting on the complex terms of an option contract.
Now, that’s not the whole story, as there was a lot of financial innovation surrounding mortgage finance, some of which notoriously exploded. “We raise concerns about the… fragility of the shadow banking system that facilitated this expansion.” Me too. And once again, fragility is the issue, not share of GDP.
A concrete example may help. A mortgage-backed security is a pool of mortgages. Suppose that such securities were bundled together into mutual funds, held at floating value or exchange-traded, just like equities, in your and my retirement accounts and our endowments’ investments. This structure would be a terrific financial innovation. Though mortgage-backed securities are a bit opaque, they are nowhere near as opaque as the entire balance sheet of, say, Citigroup. So, the monitoring and information functions we ask investors to play are much easier for a pool of mortgages than for Citigroup equity. Furthermore, such a structure would be immune to runs, bankruptices, needs for bailouts and so forth, just as equities are. The fees required to fill out the mortgage-backed security paperwork vs. the costs of bank paperwork are a tiny issue.
Now, this is not what fell apart in the financial crisis. Mortgage-backed securities and their “tranches” were held, not by floating-NAV mutual funds, but in “special purpose vehicles,” funded by rolling over very short-term debt. This structure looks like a traditional bank, whose assets are mortgages and whose liabilities are short-term debt, bank deposits. With a big exception: where is the equity, which is supposed to bear losses in the event the assets don’t work out so well?
The answer is, that the special purpose vehicles also had an off-balance-sheet guarantee from sponsoring banks. So the banks really were holding credit risk after all. But regulations did not place capital requirements on off-balance-sheet guarantees. So one function of the whole “shadow bank” was to create an actual “bank,” but evade capital requirements.
Whether or not we spent a bit more or less of GDP filling out forms and paying fees for these structures is clearly the least of its problems. The shadow bank was prone to a textbook systemic run, which is what happened.
Now, what category of problem is this? Is it an externality, public good, asymmetric information or other “market failure?” No, this seems like a clear case of “government failure,” unintended consequences of poorly structured regulation. A question for another day is whether multiplying by a factor of 10 the size of the regulatory structure – at considerable cost in resources – will prevent or exacerbate this problem. At least we know where the problem lies.
V. Runs, “shadow banking,” and the size of transactions finance.
The mention of “shadow banking” brings up a long literature on the “size of finance” that has not been mentioned yet. The issues go by the words “welfare costs of inflation,” or “optimum quantity of money,” but the central issue is the same.
As captured in the Baumol-Tobin model, we economize on money holdings by making lots of trips to the bank. But those trips are a waste of social resources. If money paid interest, or if the nominal interest rate were zero, we could avoid them all, along with the bank employees and ATM machines that service those trips. Robert Lucas (2000) put the point well:
In a monetary economy, it is in everyone's private interest to try to get someone else to hold non-interest-bearing cash and reserves. But someone has to hold it all, so all of these efforts must simply cancel out. All of us spend several hours per year in this effort, and we employ thousands of talented and highly-trained people to help us. These person-hours are simply thrown away, wasted on a task that should not have to be performed at all.High interest rate (high inflation) countries spend notoriously large resources on money changing and banking services in an effort to reduce interest costs.
Lucas (2000) approaches the question, not by adding up estimates of the services used to avoid holding money as we have, but by calculating the area under the M1 demand curve. He concludes that “the gain from reducing the annual inflation rate from 10 percent to zero is equivalent to an increase in real income of slightly less than one percent.” “Finance” under a 10 percent inflation rate is “too big” by 1% of GDP, from this clear distortion.
Lucas did not go further to estimate the benefits of reducing the nominal interest rate to zero, as when he wrote there was not much data from this regime. Depending on the rate of increase of money demand as interest rates go to zero, the area under the demand curve can be enormous. The fact that banks have increased excess reserves from about $6 billion to about $2 trillion as interest rates have fallen essentially to zero suggests that large welfare costs may have been the case.
In this context, part of the function of the “shadow banking system,” special-purpose vehicles, auction-rate securities, overnight repurchase agreements, or money market funds with risky assets (Reserve fund’s large Lehman holdings), like that of the old-fashioned banking system which created deposits, was that its liabilities were, to investors, cash-alternative assets – fixed value, first-come-first-serve accounts, paying some interest greater than zero. Rather than focus on its assets, mortages or mortgage-backed securities, perhaps we should focus on the optimal size, social benefits and costs of these liabilities.
Shadow-banking securities allow investors to avoid the needless interest costs of holding money, which is socially useful. But there is a better way to achieve the same outcome: a zero nominal rate, or money that pays interest. Relative to that benchmark, the costs of setting up the shadow banking system, for the purpose of providing interest-paying money, are wasted. More importantly, shadow-banking assets are prone to runs, which is an order of magnitude larger social cost.
In any case, following the 2007-2008 financial crisis, and perhaps more importantly the collapse of short-term interest rates to zero and the innovation that bank reserves pay interest, this form of “shadow banking” has essentially ceased to exist. RIP.
To drive home this point (and to complain about any analysis of the size of finance that stops in 2007), here are two graphs representing the size of the “shadow banking system,” culled from other papers. From Adrian and Ashcraft (2012, p. 24), the size of the securitized debt market (whose demise I regret – the problem is not securitizing debt but funding that asset with run-prone short-term liabilities)

And from Gorton and Metrick (2012), a different slice of securitized debt markets:

Furthermore, we could easily insure that the unstable parts of “shadow banking” do not come back. We can live the Friedman optimal quantity of money. The Fed can continue to pay market rates on reserves, even as interest rates rise. The Treasury can expand its plan to issue floating-rate debt, to issue floating-rate, fixed-value debt. This debt works like a money market fund: it has a constant redemption value of 1.00, interest is set on a floating basis, perhaps monthly.
Our economy can be costlessly satiated in liquidity. No resources at all need to be directed to economizing on the use of liquid assets, no resources at all need to be directed to the creation of private substitutes for interest-paying government money. The remaining interest cost of money applies only to actual cash, most of which is held overseas or illegally anyway. (US currency outstanding is about $1 trillion, which divided by 300 million is $3,300 per person, and 75% of which is $100 bills. What’s in your wallet?) And no resources need to be devoted to trying to stop, regulate, or clean up after, the runs which shadow-banking assets are prone to.
There will still be an incentive to try to issue “money-like” securities at slightly higher yield, by investing in riskier securities. Such securities would still be fragile and run-prone, which is a clear market failure. Once the economy is satiated in liquidity, the need to provide liquid assets need no longer restrain regulators from insisting that any intermediary must offer investments at floating value, and thus immune to runs. Banks do not even need to be allowed to issue deposits to fund mortgages, and can be required to issue arbitrary amounts of equity or long-term debt instead. The run-prone nature of the financial system – surely its largest cost – can easily be solved.
The emerging actual future, under Dodd-Frank, is a very highly regulated banking and shadow banking system, with a great deal of regulatory protection for incumbents. After all, too big to fail is too big to compete. The Fed is planning to reduce the interest rate on reserves, and the Treasury is not planning to issue fixed-value debt, so the shadow-banking system is likely to reemerge. This structure seems unlikely to produce much of an increase in efficiency – decline in fees and costs-- necessary to transfer an investor’s savings to a borrower’s investment. Whether it solves the “fragility” issue, especially in the era of looming sovereign debt crises, is a matter for another day.
VI. Concluding remarks
Greenwood and Scharfstein’s big picture is illuminating. The size of finance increased, at least through 2007, because fee income for refinancing, issuing, and securitizing mortgages rose; and because people moved assets to professional management; asset values increased, leading to greater fee income to those businesses. Compensation to employees in short supply – managers – increased, though compensation to others – janitors, secretaries – did not. Fee schedules themselves declined a bit.
To an economist, these facts scream “demand shifted out.” Some of the reasons for that demand shift are clearly government policy to promote the housing boom. Some of it is “government failure,” financial engineering to avoid ill-conceived regulations. Some of it – the part related to high valuation multiplied by percentage fees – is temporary. Another part – the part related to the creation of private money-substitutes – was a social waste, has declined in the zero-interest rate era, and does not need to come back. The latter can give us a less fragile financial system, which is arguably an order of magnitude larger social problem than its size.
The persistence of very active management, and very high fees, paid by sophisticated institutional investors, such as nonprofit endowments, sovereign wealth funds, high-wealth individuals, family offices, and many pension funds, remains a puzzle. To some extent, as I have outlined, this pattern may reflect the dynamic and multidimensional character of asset-market risk and risk premiums. To some extent, this puzzle also goes hand in hand with the puzzle why price discovery seems to require so much active trading. It is possible that there are far too few resources devoted to price discovery and market stabilization, i.e. pools of cash held out to pounce when there are fire sales. It is possible that there are too few resources devoted to matching the risk-bearing capacities of sophisticated investors with important outside income or liability streams to the multidimensional time-varying bazaar of risks offered in today’s financial markets.
Surveying our understanding of these issues, it is clearly far too early to make pronouncements such as “There is likely too much high-cost, active asset management,” or “society would be better off if the cost of this management could be reduced,“ with the not-so-subtle implication ( “Could be?” By whom I wonder?) that resources devoted to greater regulation (by no less naïve people with much larger agency problems and institutional constraints) will improve matters.
VII. References
Acharya, Viral V. and Lasse H. Pedersen, 2005 “Asset pricing with liquidity risk” Journal of Financial Economics, 77, 375-410.
Adrian, Tobias, and Adam B. Ashcraft, 2012, “Shadow Banking Regulation,” Federal Reserve Bank of New York Staff Report 559.
Alvarez, Fernando and Franceso Lippi, 2009, “Financial Innovation and the Transactions Demand for Cash,” Econometrica 77, 363–402. doi: 10.3982/ECTA7451
Ang, Andrew, 2010, “Liquidating Harvard,” Columbia CaseWorks ID#100312, http://www2.gsb.columbia.edu/faculty/aang/cases/Liquidating%20Harvard%20p1.pdf
Asness, Clifford, 2004, “An Alternative Future Part II: An Exploration of the Role of Hedge Funds.” Journal of Portfolio Management 31, 8-23.
Arrow, Kenneth J.,Robert Forsythe, Michael Gorham,Robert Hahn, Robin Hanson, John O. Ledyard, Saul Levmore, Robert Litan, Paul Milgrom, Forrest D. Nelson, George R. Neumann, Marco Ottaviani, Thomas C. Schelling, Robert J. Shiller, Vernon L. Smith, Erik Snowberg, Cass R. Sunstein, Paul C. Tetlock, Philip E. Tetlock, Hal R. Varian, Justin Wolfers, Eric Zitzewitz 2008, “The Promise of Prediction Markets,” Science 320 877-878 http://hanson.gmu.edu/promisepredmkt.pdf
Barber, Brad M., Yi-Tsung Lee Yu-Jane Liu, and Terrance Odean, 2008, “Just How Much Do Individual Investors Lose by Trading?” The Review of Financial Studies 22, 609-632.
Banerjee, Snehal and Ilan Kremer, 2010, “Disagreement and Learning: Dynamic Patterns of Trade,” The Journal of Finance 65, 1269–1302. doi: 10.1111/j.1540-6261.2010.01570.x
Berk, Jonathan B. and Richard C. Green, 2004, “Mutual Fund Flows and Information in Rational Markets,” Journal of Political Economic, 112, 1269-1295.
Berk, Jonathan B., 2005. “Five Myths of Active Portfolio Management," Journal of Portfolio Management, 31, 27-31.
Berk, Jonathan and Richard Stanton, 2007, “Managerial Ability, Compensation, and the closed-end fund discount” Journal of Finance 62, 529-556.
Carhart, Mark M., 1997, “On Persistence in Mutual Fund Performance,” Journal of Finance 52, 57-82.
Chevalier, Judith, and Glenn Ellison , “Risk Taking by Mutual Funds as a Response to Incentives,” Journal of Political Economy, 105, 1167-1200.
Cochrane, John H., 2003, “Stock as Money: Convenience Yield and the Tech-Stock Bubble” in William C. Hunter, George G. Kaufman and Michael Pomerleano, Eds., Asset Price Bubbles Cambridge: MIT Press 2003
Cochrane, John H., 2011, “Discount rates,” Journal of Finance 66, 1047-1108.
Cochrane, John H., 2012, “A mean-variance benchmark for intertemporal portfolio theory,” Manuscript, University of Chicago.
Cutler, David M., and Dan P. Ly, 2011, “The (Paper)Work of Medicine: Understanding International Medical Costs” Journal of Economic Perspectives 25, 3–25, page 8, http://pubs.aeaweb.org/doi/pdfplus/10.1257/jep.25.2.3
French, Kenneth R., 2008, “Presidential Address: The Cost of Active investing” The Journal of Finance 63(4) 1537-1573.
Fama, Eugene F., and Kenneth R. French 2006, “Dissecting Anomalies” Journal of Finance 63 (4) 1653-1678.
Fama, Eugene F. and Kenneth R. French, 2010, “Luck versus Skill in the Cross-Section of Mutual Fund Returns” Journal of Finance 65, 1915-1947.
Frazzini, Andrea, and Lasse Heje Pedersen, 2011a, “Betting against beta,” Manuscript, available at http://www.econ.yale.edu/~af227
Frazzini, Andrea and Lasse Heje Pedersen, 2011b, “Embedded Leverage,” Manuscript, available at http://www.econ.yale.edu/~af227
Friedman, Milton, 1969, The Optimum Quantity of Money and Other Essays. Chicago: Aldine.
Greenwood, Robin, and David S. Scharfstein, 2012, "The Growth of Modern Finance," Manuscript, Harvard University, http://www.people.hbs.edu/dscharfstein/Growth_of_Modern_Finance.pdf
Goetzmann, William N. and Sharon Oster, 2012, “Competition Among University Endowments,” NBER working paper 18173, http://papers.nber.org/papers/W18173
Gorton, Gary, and Andrew Metrick, 2012, Journal of Economic Literature 50, 128–150.
http:www.aeaweb.org/articles.php?doi=10.1257/jel.50:1.128
Grossman, Sanford G., and Joseph E. Stiglitz, 1980, “On the Impossibility of Informationally Efficient Markets” American Economic Review 70, 393-408
Kim, Oliver, and Robert E. Verrecchia, 1991, “Trading Volume and Price Reactions to Public Announcements,” Journal of Accounting Research 29, 302-321.
Kyle, Albert S., 1985, “Continuous Auctions and Insider Trading,” Econometrica 53, 1315-1336.
Kirilenko, Andrei, Albert S. Kyle, Mehrdad Samadi, Tagkan Tuzun, 2011, " The Flash Crash: The Impact of High Frequency Trading on an Electronic Market" Manuscript
Lamont, Owen, 2004, “Go Down Fighting: Short Sellers vs. Firms” Manuscript, Yale University
Lucas, Robert E., Jr., 2000, “Inflation and Welfare,” Econometrica, 68, 247–274.
Lucca, David O., and Emanuel Moench 2012, “The Pre-FOMC Announcement Drift,” Manuscript, Federal Reserve Bank of New York.
Milgrom, Paul, and Nancy Stokey, 1982, "Information, trade and common knowledge," Journal of Economic Theory 26, 17-27.
Paul Vigna and Tom Lauricella (2012) “Sawtooth Trading Hits Coke, IBM, McDonald’s, and Apple Shares” Wall Street Journal July 19, 2012, http://blogs.wsj.com/marketbeat/2012/07/19/sawtooth-trading-hits-coke-ibm-mcdonalds-and-apple-shares/
Philippon, Thomas 2008 “The Evolution of the US Financial Industry from 1860 to 2007: Theory and Evidence,” Manuscript, New York University
Pastor, Lubos, and Robert F. Stambaugh, 2012, “On the Size of the Active Management Industry,” Journal of Political Economy 120, 740-781
Scheinkman, Jose, and Wei Xiong, 2003, "Overconfidence and Speculative Bubbles," Journal of Political Economy, 1183-1219.
Weller, Brian, 2012, "Liquidity and High Frequency Trading," Manuscript, University of Chicago Booth School of Business.
Footnotes
[1]Affiliations: University of Chicago Booth School of Business, NBER, Hoover institution and Cato Institute. John.cochrane@chicagobooth.edu; http://faculty.chicagobooth.edu/john.cochrane/. (back)
[2] This is a response essay prepared for the Journal of Economic Perspectives, following Greewnood and Sharfstein (2012) “The growth of modern finance.” (back)
[3] Sources: BEA, GDP by industry and Census, 2007 Economic Census. For advertising, http://www.wpp.com/wpp/press/press/default.htm (back)
[4]Cutler and Ly (2011) p. 8, also http://thirdcoastfestival.org/library/1223-the-battle-over-billing-codes (back)
[5] The trend continues. On January 3 2012, the Wall Street Journal reported that in 2012 investors pulled $119 billion out of actively-managed funds, capping 5 years of $50-$140 billion annual withdrawals; and put $154 billion into stock and bond exchange-traded funds. “Investors sour on pro stock pickers,” http://online.wsj.com/article/SB10001424127887323689604578217944033194874.html (back)
[6] “Alpha” is the risk-adjusted expected return. It is most conventionally defined by a regression of a fund’s return, in excess of the risk free rate, on a constant and a set of index excess returns or “benchmarks.” The constant is then “alpha,” and is conventionally interpreted as extra average return accruing to the manager’s talent or superior information. The slope coefficient or “beta” represents the tendency of the fund return to move with the market portfolio; this component of risk and return can be synthesized essentially for free. The simplest calculation just uses a market-wide index on the right hand side of this regression. When portfolio strategies deviate from simple stock picking, more detailed “benchmark” indices are used to compare a manager’s performance to that available from simple passive strategies. (back)
[7] See Fama and French (2006) for example. (back)
[8] Berk and Green’s papers are much more sophisticated than this simple example, adding the uncertainty in fund returns, and a signal extraction problem, which gives rise to interesting information extraction problems and dynamics. A large literature has followed. Berk and Stanton (2007) consider the closed-end fund discount. Pastor and Stambaugh (2012) consider the industry size directly, and posit industry decreasing returns to scale in alpha production along with investor learning. Berk (2005) offers a simple exposition. (back)
[9] Chevalier and Ellison (1997). (back)
[10] See Ang (2010). (back)
[11] http://www.hmc.harvard.edu/investment-management/hybrid_model.html (back)
[12] http://www.hmc.harvard.edu/investment-management/policy_portfolio.html (back)
[13] http://investments.uchicago.edu/assetclasses.html (back)
[14] http://annualreport.uchicago.edu/page/endowment (back)
[15] http://investments.uchicago.edu/committee.html (back)
[16] Chart: Top paid CIOs of tax-exempt institutions Pensions & Investments, November 7 2011, http://www.pionline.com/article/20111107/CHART04/111109905 (back)
Subscribe to:
Posts (Atom)