Bank of America has recently settled a lawsuit with two public pension funds for $ 160 million. The case involved BofA's purchase of Merrill Lynch. Who pays for this?
As in many things, no one seems to ever ask the question: who pays? Instead, folks bask in the view that the bad guys got their due. But, did the bad guys get their due in the BofA case?
BofA is a public company. The biggest single owner of BofA are American workers of slightly above average income. How do they own it? In their pension funds.
The next largest owner is another set of average Americans -- folks who own mutual funds either in their IRA accounts or in the brokerage accounts. These folks have saved this money, invested it, and have ended up as a major owner of BofA.
So, when you ask who pays, look in the mirror. The two public pension funds who won $ 160 million in the case will be paid essentially by the owners of BofA, the single biggest group being other public pension funds. So, to make it clearer: in effect, the public pension plans of Louisiana have successfully sued the public pension plans of Arizona, New York, California, etc. One public pension plan is dipping its hands into the pockets of another pension plan. Does that sound like "getting the bad guys" to you?
If all that is going on is one group of average Americans are suing another group of average Americans (who are, by and large, unaware that they are being sued), who really wins?
That's easy. The lawyers. They are the ones who loudly trumpet these lawsuits and lobby hard to see to it that damage awards and other financial penalties are not limited by state and federal law. It's great to see those average Americans who own BofA get what they are due. "Sock it to the little guy." That's the message of the BofA lawsuit.
Meanwhile, the perpretators of whatever went wrong are completely unaffected by the outcome of this lawsuit. They are highly paid executives of BofA, that bear no penalty whatsoever from the outcome of this lawsuit. Even if they own stock, the company typically simply grants them more stock if the value of the their holdings have fallen.
So, as in other things, rich folks roll merrily along unscathed, while middle class Americans are crushed once more.
Anytime you read about a public corporation being sued for some malfeasance -- think Enron, Exxon, World Com, whoever -- and you wonder who pays if the lawsuit is successful, look in the mirror. It's the little guy that pays for all of this litigation. The Enrons of the world aren't owned by some rich bad guy. The Enrons of the world are owned by average Americans, mostly trying to save for their old age. These lawsuits make it tougher for these folks to retire. But, the media seems to think that bludgeoning the retirement hopes and dreams of the average American with these kinds of lawsuits is "getting the bad guys." I guess that tells us who the media really thinks the bad guys are.
Meanwhile the Wall Street Journal reported yesterday that Bank of America was planning more layoffs. Maybe BofA needed to produce some cost cutting to pay off the recent victory by the plaintif lawyers. That should get the bad guys! Sock it to them!
Sunday, April 22, 2012
Saturday, April 21, 2012
Longer Term View.
I would like to share one chart from Stock Trader’s Almanac which they have put out in their free report.

This chart makes the distinction of a Presidential Year cycle. Because all incumbent Presidents try to pump the market and the current one is no exception. They all need money from Wall St and TBTF Banks for their campaign.
This chart became available only yesterday. But I have been writing the same thing for past so many days and months.
The only thing that is important to the market; How much money is out there and where that money wants to go. To all the Uber economorons out there who are predicting imminent doom of fiat money, sorry guys, I have some bad news for you. You will have to wait.
Did you read the latest efforts of global re-flation? IMF has just increased its war chest by $ 440 billions and most of the money is coming from the developing countries. http://www.reuters.com/article/2012/04/21/us-imf-idUSBRE83I19X20120421
This is specially aimed for Spain and Italy. Why do you think the central banks will stop here? What prevents them to write another cheque to themselves again. Isn’t that they are doing for so many months?
There is a time for everything, even for serious corrections. If you look at the monthly chart of SPX

We are in a range for over 15 years now and are about to complete the upper side of the range before any serious correction can happen. Let ZH scream and shout about Spain and break up of Euro, nothing much is going to happen till the end of 2012. For now it’s all noise and fear mongering is a very good business model.
However, that does not mean I am suggesting that we should go long now. On the contrary, I think we have a short term opportunity for a fishing expedition when a short and violent correction takes place. I expect that correction, between 5-10% should start by next week, after Apple results. I plan to write a short note on Apple tomorrow. I think end of such correction will be a buying opportunity, not now. For now, we can either sit on cash or try the short side, but do not expect any major correction.
I wish you a very enjoyable weekend. Thank you for reading http://bbfinance.blogspot.ca/ . Please forward it to your friends and invite them to join me in twitter. ( @BBFinanceblog).

The Public Pension Saga
State and local governments in the United States have a major fiscal disaster on their hands. The obligations of these governments embodied in their pension plans for government employees are not funded and there are no serious plans to fund them. The result: a combination of looming state bankruptcies and drastically reduced pension benefits for covered employees. The biggest single group of pensioners threatened by this looming disaster are public school teachers.
Yesterday, Democratic Governor Pat Quinn of Illinois made a last ditch desperate effort to avoid disaster in Illinois by urging state employees to "voluntarily" accept a shift in the retirement age to 67 and to contribute an additional three percent of salary to their pension funds. This is not a reform, this is an emergency and Quinn is a Democrat elected with strong union support in a traditionally Democratic state. Even if Quinn's suggestion is taken up by public employees, which it won't be, it is only a drop in the bucket compared to the real problem that Illinois' pension fund faces. That tells you how bad things have become.
Illinois is in the vanguard of this coming catastrophe. New York, California, New Jersey are waiting in the wings. South Dakota may be the only state of the 50 states in the US that has a real shot at delivering on their public employee retirement promises. No one else is coming anywhere near close to properly funding their systems. Some states, Virginia is an example, have recently enacted "reforms" that will have minimal impact on the massive funding deficits of their public pension plans. These reforms are notable in their inadequacy.
Inevitably, the younger members of the work force will find little or nothing waiting for them when the time for retirement comes. This parallels the outcome of social security for this same work force demographic. There is simply nothing out there to fund the promises that politicians continue to make and continue to pretend will be there when the time comes.
On this score, the coming retirement disaster is a bi-partisan affair. Republicans as well as Democrats are both complicit in confusing the public as to where this situation is headed. Ultimately, Democrats like Governor Quinn of Illinois and Republicans yet to be named will be forced to tell the truth to their employees, well past the date that these employees could increase their personal savings to offset the abandoned promises of the politicians. Government and politics at its worst.
Yesterday, Democratic Governor Pat Quinn of Illinois made a last ditch desperate effort to avoid disaster in Illinois by urging state employees to "voluntarily" accept a shift in the retirement age to 67 and to contribute an additional three percent of salary to their pension funds. This is not a reform, this is an emergency and Quinn is a Democrat elected with strong union support in a traditionally Democratic state. Even if Quinn's suggestion is taken up by public employees, which it won't be, it is only a drop in the bucket compared to the real problem that Illinois' pension fund faces. That tells you how bad things have become.
Illinois is in the vanguard of this coming catastrophe. New York, California, New Jersey are waiting in the wings. South Dakota may be the only state of the 50 states in the US that has a real shot at delivering on their public employee retirement promises. No one else is coming anywhere near close to properly funding their systems. Some states, Virginia is an example, have recently enacted "reforms" that will have minimal impact on the massive funding deficits of their public pension plans. These reforms are notable in their inadequacy.
Inevitably, the younger members of the work force will find little or nothing waiting for them when the time for retirement comes. This parallels the outcome of social security for this same work force demographic. There is simply nothing out there to fund the promises that politicians continue to make and continue to pretend will be there when the time comes.
On this score, the coming retirement disaster is a bi-partisan affair. Republicans as well as Democrats are both complicit in confusing the public as to where this situation is headed. Ultimately, Democrats like Governor Quinn of Illinois and Republicans yet to be named will be forced to tell the truth to their employees, well past the date that these employees could increase their personal savings to offset the abandoned promises of the politicians. Government and politics at its worst.
Friday, April 20, 2012
Arthur C. Clarke predicts the internet and PCs
Arthur C. Clarke forecasts the future of 2001, a time when home computers and interconnectivity with others through technology are commonplace (via Eddie Markets).
How to lie with statistics
Along with David Leonhardt's interesting article "Taxmageddon," last weekend's New York Times Sunday Review included this pair of graphs. These belong high up in the pantheon of "How to lie with statistics" (one of my favorite books) examples.
These graphs are paired left and right in the original. (I made them big and split them up so you could see them. They're even clearer on the Times' website) On the left, is this graph:

Right next to it, is this one

(The graphs had little to do with the article, so I presume they are the work of the Times staff, not Leonhardt.)
It's damning, right? The rich got huge tax cuts (top graph) and so made a ton of money courtesy of the government (+528% change in income, numbers to the right of the first graph). The rich are also feeding at the trough of tax breaks (bottom graph). Outrage!
***
Now wait a minute here...The top graph is a tax rate, the percentage of income paid, while the bottom graph is total dollars. To say this is comparing apples and oranges is an insult to fruits.
In fact, wealthier people pay nearly all Federal income taxes. So it's not surprising that they benefit more in dollar terms from tax deductions -- except credits, which is money the government pays you even if you pay no taxes.
If we expressed the bottom graph as a percentage of taxes, or a percentage of income -- the same units as the top graph -- you'd see a dramatic reversal of the implication. Since the lower percentiles have so much less income and pay so much less taxes, the graph would suggest those with less income get the largest (percent) benefits.
***
The top graph is even more misleading, at least for the Times' goal which is to back a raise in Federal income taxes for the wealthy.
Where does this 60 and 71% tax rate in the 1960s come from? The basic fact of the Federal taxation is that it raises about 20% of GDP despite wild variation in the statutory tax rates. In 1960 Federal tax receipts (NIPA table 3.2) divided by national income (NIPA 1.12) were 93.9/2013.9 = 19.8%. In 2004 this ratio was 2013.9/10534.0 = 19.1%.
Statutory tax rates in the 1960s were as much as 90% marginal rates on the highest incomes. (Remember George Harrison's "Taxman?" "One for you, 19 for me." He wasn't kidding.) But the tax code was so shot full of loopholes that the Federal government didn't collect nearly that fraction of income from anyone.
So where does the 71% come from? At least the Times gives their source, so you can go back and see what the heck the number means. These are estimates by Emmanuel Saez and Thomas Piketty of total Federal taxes -- individual income, corporate income, payroll (Social Security, etc.), and estate taxes -- divided by an estimate of income, which excludes Government transfers. (The paper is here and a longer working paper version here.)
To what extent is this the statutory rate and to what extent is it actual money paid? I'm still tracking this down, but it appears to be some of each. For example, "We use the TAXSIM calculator developed at the National Bureau of Economic Research ... to compute federal individual income taxes." That seems to imply this is taxes the NBER thinks they should have paid, not what people actually paid. But they do have individual level IRS data, so in theory know what people actually paid. On the other hand, it doesn't add up: Total tax recepits are 20% of income. So how can everybody's rate come down yet the total rate stay stuck at 20%? How can the rate of everybody who has any money in 1960 be above 20%, yet the average is still 20%?
But let's not get in to the depths of the sausage factory, as it does not matter for the point here. (And my head starts to hurt anytime I delve in to the details of this kind of calculation.)
The important point, for the Times is that graph has basically nothing to do with Federal income taxes. All of the action comes from Saez and Piketty's assigment of corporate taxes and estate taxes. They assume all corporate taxes are paid by stockholders and bondholders. This is conceptually right -- it is not true that "corporations" bear any tax burden. Someone is paying, through higher prices, lower salaries, or lower returns to investors. Saez and Piketty assume it's all the latter.
Here is Saez and Piketty's breakdown of how taxes changed between 1960 and 2004 (source):
 The actual individual income tax line has not changed much at all, other than to fall slightly for all income groups. Almost all of the Times' fabled taxes the rich were happily paying in 1960 comes from Saez and Piketty's assignment of corporate taxes to wealthy people and their calculations of estate taxes! (Estate taxes are notorious for the games the rich pay to avoid them.)
(It also appears to me that Saez and Piketty are a bit off here: If you charge corporate income tax against the rich, don't you have to divide that tax by an income measure that includes corporate income? In general, you have to divide taxes by pre-tax income not post-tax income. Dividing corporate taxes by individual income, and not including corporate income, can produce "rates" above 100%. On the other hand, if their "income" number attributes all corporate income as individual income to the wealthy, then the distribution of income is grossly overstated. Ok, we're not going in to the sausage factory, maybe for another post someday, but I'm still scratching my head.)
As Piketty and Saez put the matter:
Now, when we talk about the "Buffet rule," that is about raising the individual Federal income tax rate. If we calculate Warren Buffet's taxes this way -- including all corporate taxes paid by all Berkshire Hathaway companies (and why not property taxes, business taxes, business contributions to social insurance, and all other business-paid taxes), Buffet's tax rates would be correctly measured, and a lot more than his secretary's tax rate!
This assignment of corporate taxes takes us into the dark territory of who bears the burden of taxes rather than who actually pays them. Saez and Piketty are assuming that rates of return on investments are reduced because corporations pay taxes, so rich people get less return than they would otherwise. Hence, it's "like" paying more taxes. Ok, that's how economists think about things, but why stop here? Who really bears the burden of the much larger wedge between what employers pay and what employees get? And all the other taxes, that distorts prices and wages all over the place. And while we're at it, why not "who bears the burden of regulation?" through higher prices or lower returns?
Bottom line: It may be fine for Saez and Piketty's purpose, but I doubt any New York Times reader had the faintest idea they were looking at a graph that primarily said "rich people were hurt by taxes in the 1960s not because they actually paid more taxes but because we assume corporate income taxes drove down the rates of return on their investments!"
And, in case you think this all means we should go back to the days of "Mad Men" taxation, Saez and Piketty warn:
***
Now, look at the nefarious pairing of the decline in (statutory) tax rate with the change in income on the right hand side of the top graph. We cut rich people's taxes and look how they got richer!
Here, the Times got too clever by half. The cause and effect insinuation here is actually a supply sider's dream, if you can read and add. The insinuation is, the rich got richer because they got to keep all that income that they're not paying to the government. Even that doesn't add up: a 528% rise is much more than (1-0.34)/(1-0.71) = 2.28 = 128% rise in after-tax income.
But the tabulated rise is in pretax income. (At least the labels are honest.) As tax rates came down, people went out and made an enormous amount more income in the first place.
A 528% increase in income is a lot. 71% x $100 = $71.00. 34% x $100 x (1+5.28) = $213.52. So, using the New York Times' numbers, we would infer that lowering the tax rate on the top earners corresponded to tripling the tax revenue earned from that group! The rich are, apparently, paying much more in taxes than before.
If you take the Times' numbers seriously, Art Laffer's wildest dreams came true.
***
Update: Abel Winn notes it's worse than I said:
These graphs are paired left and right in the original. (I made them big and split them up so you could see them. They're even clearer on the Times' website) On the left, is this graph:

Right next to it, is this one

(The graphs had little to do with the article, so I presume they are the work of the Times staff, not Leonhardt.)
It's damning, right? The rich got huge tax cuts (top graph) and so made a ton of money courtesy of the government (+528% change in income, numbers to the right of the first graph). The rich are also feeding at the trough of tax breaks (bottom graph). Outrage!
***
Now wait a minute here...The top graph is a tax rate, the percentage of income paid, while the bottom graph is total dollars. To say this is comparing apples and oranges is an insult to fruits.
In fact, wealthier people pay nearly all Federal income taxes. So it's not surprising that they benefit more in dollar terms from tax deductions -- except credits, which is money the government pays you even if you pay no taxes.
If we expressed the bottom graph as a percentage of taxes, or a percentage of income -- the same units as the top graph -- you'd see a dramatic reversal of the implication. Since the lower percentiles have so much less income and pay so much less taxes, the graph would suggest those with less income get the largest (percent) benefits.
***
The top graph is even more misleading, at least for the Times' goal which is to back a raise in Federal income taxes for the wealthy.
Where does this 60 and 71% tax rate in the 1960s come from? The basic fact of the Federal taxation is that it raises about 20% of GDP despite wild variation in the statutory tax rates. In 1960 Federal tax receipts (NIPA table 3.2) divided by national income (NIPA 1.12) were 93.9/2013.9 = 19.8%. In 2004 this ratio was 2013.9/10534.0 = 19.1%.
Statutory tax rates in the 1960s were as much as 90% marginal rates on the highest incomes. (Remember George Harrison's "Taxman?" "One for you, 19 for me." He wasn't kidding.) But the tax code was so shot full of loopholes that the Federal government didn't collect nearly that fraction of income from anyone.
So where does the 71% come from? At least the Times gives their source, so you can go back and see what the heck the number means. These are estimates by Emmanuel Saez and Thomas Piketty of total Federal taxes -- individual income, corporate income, payroll (Social Security, etc.), and estate taxes -- divided by an estimate of income, which excludes Government transfers. (The paper is here and a longer working paper version here.)
To what extent is this the statutory rate and to what extent is it actual money paid? I'm still tracking this down, but it appears to be some of each. For example, "We use the TAXSIM calculator developed at the National Bureau of Economic Research ... to compute federal individual income taxes." That seems to imply this is taxes the NBER thinks they should have paid, not what people actually paid. But they do have individual level IRS data, so in theory know what people actually paid. On the other hand, it doesn't add up: Total tax recepits are 20% of income. So how can everybody's rate come down yet the total rate stay stuck at 20%? How can the rate of everybody who has any money in 1960 be above 20%, yet the average is still 20%?
But let's not get in to the depths of the sausage factory, as it does not matter for the point here. (And my head starts to hurt anytime I delve in to the details of this kind of calculation.)
The important point, for the Times is that graph has basically nothing to do with Federal income taxes. All of the action comes from Saez and Piketty's assigment of corporate taxes and estate taxes. They assume all corporate taxes are paid by stockholders and bondholders. This is conceptually right -- it is not true that "corporations" bear any tax burden. Someone is paying, through higher prices, lower salaries, or lower returns to investors. Saez and Piketty assume it's all the latter.
Here is Saez and Piketty's breakdown of how taxes changed between 1960 and 2004 (source):

(It also appears to me that Saez and Piketty are a bit off here: If you charge corporate income tax against the rich, don't you have to divide that tax by an income measure that includes corporate income? In general, you have to divide taxes by pre-tax income not post-tax income. Dividing corporate taxes by individual income, and not including corporate income, can produce "rates" above 100%. On the other hand, if their "income" number attributes all corporate income as individual income to the wealthy, then the distribution of income is grossly overstated. Ok, we're not going in to the sausage factory, maybe for another post someday, but I'm still scratching my head.)
As Piketty and Saez put the matter:
The larger progressivity in 1960 is not mainly due to the individual income tax. The average individual income tax rate in 1960 reached an average rate of 31 percent at the very top, only slightly above the 25 percent average rate at the very top in 2004. Within the 1960 version of the individual income tax, lower rates on realized capital gains, as well as deductions for interest payments and charitable contributions, reduced dramatically what otherwise looked like an extremely progressive tax schedule, with a top marginal tax rate on individual income of 91 percent.Note the tiny percentages of total income involved. These are not going to balance anyone's budget.
The greater progressivity of federal taxes in 1960, in contrast to 2004, stems from the corporate income tax and the estate tax. The corporate tax collected about 6.5 percent of total personal income in 1960 and only around 2.5 percent of total income today. Because capital income is very concentrated, it generated a substantial burden on top income groups. The estate tax has also decreased from 0.8 percent of total personal income in 1960 to about 0.35 percent of total income today. As a result, the burden of the estate tax relative to income has declined very sharply since 1960 in the top income groups
Now, when we talk about the "Buffet rule," that is about raising the individual Federal income tax rate. If we calculate Warren Buffet's taxes this way -- including all corporate taxes paid by all Berkshire Hathaway companies (and why not property taxes, business taxes, business contributions to social insurance, and all other business-paid taxes), Buffet's tax rates would be correctly measured, and a lot more than his secretary's tax rate!
This assignment of corporate taxes takes us into the dark territory of who bears the burden of taxes rather than who actually pays them. Saez and Piketty are assuming that rates of return on investments are reduced because corporations pay taxes, so rich people get less return than they would otherwise. Hence, it's "like" paying more taxes. Ok, that's how economists think about things, but why stop here? Who really bears the burden of the much larger wedge between what employers pay and what employees get? And all the other taxes, that distorts prices and wages all over the place. And while we're at it, why not "who bears the burden of regulation?" through higher prices or lower returns?
Bottom line: It may be fine for Saez and Piketty's purpose, but I doubt any New York Times reader had the faintest idea they were looking at a graph that primarily said "rich people were hurt by taxes in the 1960s not because they actually paid more taxes but because we assume corporate income taxes drove down the rates of return on their investments!"
And, in case you think this all means we should go back to the days of "Mad Men" taxation, Saez and Piketty warn:
The surge in top incomes since the 1970s has been driven in large part by a steep increase in the labor income component, due in large part to the explosion of executive compensation. As a result, labor income now represents a substantial fraction of income at the top. This change in composition is important to keep in mind, because the corporate and estate taxes that had such a strong effect on creating progressivity in the 1960s would have relatively little effect on labor income.In sum, this graph has nothing to do with the main point -- establishing facts about who pays Federal income taxes. It would be great if our national discussion were to broaden up and consider all taxes -- yes, proper attribution of corporate taxes (all corporate taxes); along with estate, excise, state and local income taxes, sales taxes, property taxes, and so on and so forth. And proper attribution of the burden of taxes. But it isn't.
***
Now, look at the nefarious pairing of the decline in (statutory) tax rate with the change in income on the right hand side of the top graph. We cut rich people's taxes and look how they got richer!
Here, the Times got too clever by half. The cause and effect insinuation here is actually a supply sider's dream, if you can read and add. The insinuation is, the rich got richer because they got to keep all that income that they're not paying to the government. Even that doesn't add up: a 528% rise is much more than (1-0.34)/(1-0.71) = 2.28 = 128% rise in after-tax income.
But the tabulated rise is in pretax income. (At least the labels are honest.) As tax rates came down, people went out and made an enormous amount more income in the first place.
A 528% increase in income is a lot. 71% x $100 = $71.00. 34% x $100 x (1+5.28) = $213.52. So, using the New York Times' numbers, we would infer that lowering the tax rate on the top earners corresponded to tripling the tax revenue earned from that group! The rich are, apparently, paying much more in taxes than before.
If you take the Times' numbers seriously, Art Laffer's wildest dreams came true.
***
Update: Abel Winn notes it's worse than I said:
The top graph’s y-axis is scaled according to position in the income distribution, while the bottom graph’s y-axis is scaled according to position in the distribution of taxpayers. Since only about half of income earners pay income taxes, being in the top x% of the income distribution means that one is in about the top 2x% of taxpayers. So when we see massive benefits going to the top 20% of taxpayers, that means the tax code was benefiting the top 40% of income earners. But that doesn’t fit very nicely into the 99% rhetoric that we’ve been hearing so much of late, and that the NYT graphs appear to be backing.
Slowdown Ahead?
Some regions and sectors of the US economy are moving right along. In the aggregate, though, the economy may be slowing and slipping back into recession. It is not just housing.
The current prosperity has limits. Economic expansion depends upon aggressive entrepreneurial activity and, except in technology, we're not seeing much on the entrepreneurial front. Why?
Some roadblocks to prosperity are "hard" obstacles and some are "soft" obstacles. The "hard" obstacles are excessive government regulation, the government-imposed cost of labor, and sharply rising energy costs. Most of these "hard" obstacles are self-imposed problems for the US economy. We have put these restrictions on our economy and they are now a serious impediment to an economic recovery.
The "soft" obstacles are the almost daily attacks by the White House and its supporters on the business community. These attacks have created a gloomy background that clouds and dampens the American entrepreneurial spirit. Business folks are discouraged. They feel that they are being singled out for political reasons by the current administration. The White House seems to believe that American society is an "unfair" society dominated by greedy and rapacious businesses and the White House trumpets the "unfairness" theme at every opportunity.
These things matter. Both the "hard" and "soft" obstacles are weighing heavily on the economic recovery and dampening the prospects for Americans in the bottom half of the wealth and income pool. The comfortable and the wealthy, who by and large support the policies that have created these obstacles, are largely unaffected and can preoccupy themselves with "fairness" discussions and other irrelevant topics.
What could kick the American economy into a more sustained downturn is the fear of the future. There has been no progress on reducing the fiscal footprint of the various levels of American government. This means that a chaotic fiscal future is becoming inevitable. Politicians have quit discussing the level of government debt in the US, which suggests they have become resigned to this chaotic future. Debt problems in the US are far, far more significant than those currently plaguing the Eurozone and we all watch daily how the Eurozone countries are faring.
The Eurozone is now in recession and things are getting worse. America may not be far behind. If the "Affordable Care Act" is sustained by the courts, which I suspect is more likely than not, and if nothing is done regarding the tax increases due to automatically take place next January, then the US economy will likely fall back into recession in the second half of 2012.
There are bits and pieces of evidence that are beginning to accumulate to suggest that the probability of a second half economic slide in the US is increasingly much more likely. There is almost no shot that real economic prosperity is on the way. With current economic policies, the 3 percent growth days of America's past are a fading memory. The best that we can hope for, and it is growing increasing unlikely, is that the economy can limp through the balance of 2012 at a 2 percent real GDP growth pace. It is a sad state of affairs that 2 percent economic growth is now an "optimistic" scenario.
The current prosperity has limits. Economic expansion depends upon aggressive entrepreneurial activity and, except in technology, we're not seeing much on the entrepreneurial front. Why?
Some roadblocks to prosperity are "hard" obstacles and some are "soft" obstacles. The "hard" obstacles are excessive government regulation, the government-imposed cost of labor, and sharply rising energy costs. Most of these "hard" obstacles are self-imposed problems for the US economy. We have put these restrictions on our economy and they are now a serious impediment to an economic recovery.
The "soft" obstacles are the almost daily attacks by the White House and its supporters on the business community. These attacks have created a gloomy background that clouds and dampens the American entrepreneurial spirit. Business folks are discouraged. They feel that they are being singled out for political reasons by the current administration. The White House seems to believe that American society is an "unfair" society dominated by greedy and rapacious businesses and the White House trumpets the "unfairness" theme at every opportunity.
These things matter. Both the "hard" and "soft" obstacles are weighing heavily on the economic recovery and dampening the prospects for Americans in the bottom half of the wealth and income pool. The comfortable and the wealthy, who by and large support the policies that have created these obstacles, are largely unaffected and can preoccupy themselves with "fairness" discussions and other irrelevant topics.
What could kick the American economy into a more sustained downturn is the fear of the future. There has been no progress on reducing the fiscal footprint of the various levels of American government. This means that a chaotic fiscal future is becoming inevitable. Politicians have quit discussing the level of government debt in the US, which suggests they have become resigned to this chaotic future. Debt problems in the US are far, far more significant than those currently plaguing the Eurozone and we all watch daily how the Eurozone countries are faring.
The Eurozone is now in recession and things are getting worse. America may not be far behind. If the "Affordable Care Act" is sustained by the courts, which I suspect is more likely than not, and if nothing is done regarding the tax increases due to automatically take place next January, then the US economy will likely fall back into recession in the second half of 2012.
There are bits and pieces of evidence that are beginning to accumulate to suggest that the probability of a second half economic slide in the US is increasingly much more likely. There is almost no shot that real economic prosperity is on the way. With current economic policies, the 3 percent growth days of America's past are a fading memory. The best that we can hope for, and it is growing increasing unlikely, is that the economy can limp through the balance of 2012 at a 2 percent real GDP growth pace. It is a sad state of affairs that 2 percent economic growth is now an "optimistic" scenario.
Thursday, April 19, 2012
Typical Topping Process
This is a typical topping process we are witnessing. Most of the indicators have turned south and tomorrow is the last day for cycle top. It does not mean that we will have huge sell-off from tomorrow. Actually we might see a green day tomorrow being Op-Ex. As they say, topping is a process.
Gone are the days when the index will go up on the one way street no matter what. But I still do not have any target for downside. Will it be similar to 2011?
Given the fact that it is a Presidential election year when the incumbent grease the market to stay in power and huge liquidity around, I do not think a huge sell off like 2011 is in cards.
I am still waiting on the sideline without being short. One of the simple sell signal occurs when fast moving averages like 20 DMA crosses under slow moving averages, say 50 DMA. Right now they are coming close have no crossover has occurred yet.
Gold seems to be coming to a bottom but I would still wait for sell-off in equities to see how all the risk assets behave together. Here is a long term weekly chart of GLD.
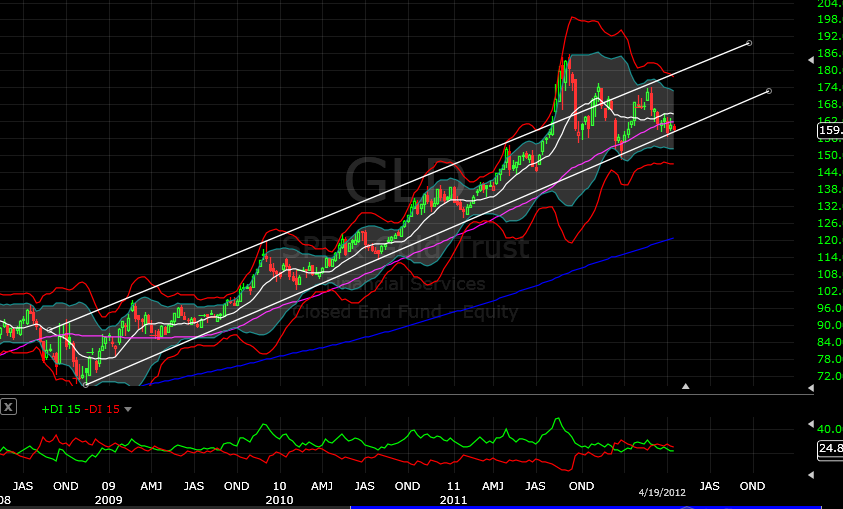
As you can see, the price of gold is just touching the trend line. Even with the correction it has not broken the trend line yet. Gold may well cross $ 2500 in the next 12 months before the bull market in Gold ends.
Hope you all are in cash and cushy. Thank you for sharing my thoughts and reading http://bbfinance.blogspot.ca/
Subscribe to:
Posts (Atom)